
Special Weather Systems of the Northeastern United States
Abstract. This page describes 21 weather systems that shape day-to-day weather in the northeastern United States, from the sea breeze and the nor’easter to cold air trapped against the Appalachians. Two systems from elsewhere in the country, the Great Plains dryline and the California Santa Ana wind, are included for contrast. The page is written for readers with a science background but no training in meteorology. Each entry opens with a one-sentence definition and then describes how the system forms, how it changes temperature, wind, cloud and precipitation, and how forecasters recognize it, with reference to published studies. Each is illustrated with a schematic drawn for this page and a map of a real case from a reanalysis of past weather, and most entries quote the National Weather Service forecasters who handled that case.
- Coastal and marine systems
- Terrain-forced systems
- Boundary layer and radiation
- Winter precipitation and rapidly deepening cyclones
- Convective and mesoscale boundaries
- Large-scale patterns
Also: How to read this page · Table 1 · Data and methods · References
How to read this page
These notes can be skimmed now and consulted later, when a map or a unit is unclear.
- Pressure levels as heights
- Air pressure falls with height, so meteorologists often name a height by its pressure in hectopascals (hPa; 1 hPa equals 1 millibar, mb). Approximate heights: 1000 hPa, near sea level; 925 hPa, 750 m (2500 ft); 850 hPa, 1.5 km (5000 ft); 700 hPa, 3 km (10 000 ft); 500 hPa, 5.5 km (18 000 ft), where about half the mass of the atmosphere lies below.
- Heights on upper-level maps
- Maps of one pressure level show contours of the height of that pressure surface above sea level, in decameters (dam; 1 dam = 10 m, so 552 dam is 5520 m). Low heights mark troughs and cold air, high heights ridges and warm air. An anomaly is the difference from the long-term average for that place and season.
- Sea-level pressure
- Mean sea-level pressure (MSLP) is the pressure measured at a station and adjusted to sea level, so that stations at different elevations can be compared. Lines of equal pressure are called isobars. On maps H marks a center of high pressure and L a center of low pressure.
- Temperature and dewpoint
- The 2-m temperature is the air temperature 2 m above the ground, what an ordinary outdoor thermometer reads. The dewpoint is the temperature to which the air would have to cool to become saturated; a higher dewpoint means more water vapor. In the text, surface temperatures are given in °F with °C in parentheses; the maps use °C. Temperature differences on the maps are often given in kelvin (K): a difference of 1 K equals 1 °C (1.8 °F).
- Wind
- Winds are named for the direction they blow from: a northeast wind blows from the northeast toward the southwest. Surface wind is measured 10 m above the ground (the 10-m wind). On maps a wind barb's shaft points into the wind; each long feather is 10 knots (kt), a short feather 5 kt and a triangular pennant 50 kt. One knot is about 0.5 m s−1 or 1.15 mph.
- Ridges, troughs and inversions
- A ridge is an elongated area of high pressure and a trough one of low pressure; higher up they appear as northward and southward bends in the jet stream, the band of fastest winds about 9–12 km up. Temperature normally falls with height; an inversion is a layer where it rises instead, and it acts as a lid on mixing. A sounding is a profile of temperature, humidity and wind against height, measured by an instrument carried up by a weather balloon, usually at 0000 and 1200 UTC.
- Contours and shading
- On the maps, lines (contours) join points with equal values of one quantity, and color shading shows a second quantity. Each figure caption says which is which and gives the units. Units with negative powers are rates: m s−1 is meters per second, mm h−1 millimeters per hour, and 10−5 s−1 (a typical rate at which large-scale winds converge or spin) is 0.00001 per second. Latitude and longitude are given in degrees north of the equator (°N) and west of Greenwich (°W); New England lies at about 41–47°N.
- ERA5 reanalysis
- A reanalysis is a reconstruction of past weather made by combining historical observations with a weather-forecast model. ERA5 gives hourly values from 1940 onward on a grid of 0.25° of latitude and longitude, about 20–30 km between grid points over the Northeast. Features only a few grid lengths wide, such as a sea-breeze front or a thunderstorm gust front, are smoothed out or missed, so for those the ERA5 map shows the setting, and surface stations and radar show the feature itself.
- Time
- Times are given in Coordinated Universal Time (UTC, written “Z” on weather maps), with local time in parentheses. Eastern Standard Time (EST) is UTC − 5 h and Eastern Daylight Time (EDT) is UTC − 4 h, so 1800 UTC is 1 p.m. EST in winter and 2 p.m. EDT in summer. Central and Pacific daylight times (CDT, PDT) are UTC − 5 h and UTC − 7 h.
- Forecaster quotations
- National Weather Service (NWS) forecast offices publish an Area Forecast Discussion (AFD) several times a day, a technical note explaining the reasoning behind the forecast. Quotations come from the offices for Boston (BOX, located in Norton, Mass.; older products are headed “Taunton”), New York (OKX, Upton, N.Y.), Philadelphia (PHI, Mount Holly, N.J.), Baltimore/Washington (LWX, Sterling, Va.) and Buffalo (BUF). Each links to the archived text of the product it is taken from.
- Sources
- Published work is cited by author and year, for example Miller et al. (2003), and listed with its DOI under References. Words in quotation marks are quoted exactly from the source; all other text is paraphrase. Forecasting methods described without a citation are standard National Weather Service practice.
Table 1. The 21 systems described on this page. “Scale” is the typical size; “season” is when the system is most common or matters most in the Northeast. The dryline and the Santa Ana wind do not occur in the Northeast and are included for contrast.
| System | Scale | Season | Main effect in the Northeast |
|---|---|---|---|
| 1.1 Sea breeze | Front reaches tens of km inland | Sunny days, mainly spring and summer | Cooler, more humid afternoons at the shore; earlier daily high at the coast |
| 1.2 Backdoor cold front | Front hundreds of km long; shallow cold air | Spring and early summer | Sudden drop of 10–30 °F (6–17 °C) on a northeast wind while inland areas can stay warm |
| 1.3 Coastal front | Hundreds of km long; temperature change across about 10 km | Late autumn to early spring | Sharp temperature contrast near the coast, often the line between rain and snow |
| 1.4 Marine layer and sea fog | Tens to hundreds of km of coast and water | Late spring and summer | Fog and low cloud keep the shore cool and gray |
| 1.5 Nor’easter | About 1000 km | Autumn to spring, most often in winter | Heavy snow or rain, strong northeast winds, coastal flooding |
| 1.6 Miller type B redevelopment | About 1000 km | Winter | A new coastal low takes over from an inland one, making snow totals hard to forecast |
| 2.1 Cold-air damming | Several hundred km along the mountains; cold layer usually under 1 km deep | Mainly the cool season | Overcast, cold days with drizzle or fog east of the Appalachians (also east of the southern New England hills); sets up freezing rain |
| 2.2 Downslope (lee) warming | Downwind of ridges about 1 km high | Any season | A dry, gusty west wind and an afternoon high a few °F higher; can stop the sea breeze |
| 2.3 Lake-effect snow | Narrow bands downwind of the lakes; snow depth can vary by 100 cm (40 in) within 50 km | November to January | Very heavy, localized snow downwind of the Great Lakes, e.g. over 4 ft (1.2 m) near Buffalo in Nov 2014 |
| 3.1 Radiational cooling and cold pools | Valleys and low ground, a few km | Clear, calm nights; strongest over fresh snow | Temperatures can differ by 10 °F (5–6 °C) or more over a few miles; frost and fog |
| 3.2 Morning inversion and mixing out | Lowest few hundred meters | Any season; mornings after cold nights | Temperature flat through the morning, then a rise of several degrees within an hour once the inversion breaks |
| 3.3 Overrunning and the midnight high | Hundreds of km ahead of a warm front | Mainly winter | Temperatures that rise overnight; about one winter day in five at Boston and one in four at New York has its high in the first or last hour of the day |
| 3.4 Nocturnal low-level jet | A band of fast wind a few hundred meters above the ground | At night, peaking after midnight | Carries warm, humid air north overnight and can feed nighttime storms; strongest over the Great Plains |
| 4.1 Freezing rain and ice storms | Warm layer 1–3 km up over a shallow freezing layer | Winter | Rain at 28–32 °F that freezes on contact; a quarter inch (6 mm) of ice brings down branches and power lines |
| 4.2 Bomb cyclone | About 1000 km or more | Cold season, mainly over the ocean | Central pressure falls at least about 18–20 hPa in 24 h; rapidly rising winds, heavy snow or rain, coastal flooding |
| 4.3 Alberta clipper | Small, fast-moving low | Mostly December and January | A few inches of light, powdery snow, then gusty northwest winds and sharp cooling |
| 5.1 Gust front and cold pool | Cold pool about 1 km deep, narrower than a model grid | Thunderstorm season | Sudden gust and wind shift; temperature can fall more than 10 °F (5.5 °C) within minutes |
| 5.2 Derecho | Damage swath at least 400 km (250 mi) long | Thunderstorm season | Gusts of 60–90 mph, fallen trees, long power outages; most occur in the central United States, some reach the Northeast |
| 5.3 Dryline | Moisture change across a few to tens of km | Spring; most often mid- to late May | Not a Northeast feature; a Great Plains moisture boundary where severe storms and tornadoes form |
| 6.1 Omega block | Several thousand km; lasts a week or more | Any season | Persistent weather: clear, warm, dry days under the ridge, cool and showery days under the lows |
| 6.2 Santa Ana wind | Southern California mountains, passes and coast | Autumn to early spring | Not a Northeast feature; hot, very dry, gusty wind and severe fire weather, the opposite of the onshore marine regime |
Key to the schematics. The schematics are simplified drawings, not to scale. Cross-sections are vertical slices through the atmosphere; maps have north at the top.
- cold front (triangles point the way it moves)
- cold or cool air moving
- warm air moving
- other air motion
- cold air or sea water
- warm air
- land
- high- and low-pressure centers
1. Coastal and marine systems
The cold North Atlantic lies beside land that heats and cools much faster than the water. The contrast between them drives the six systems below, from the daily sea breeze to the winter nor’easter.
1.1 Sea breeze
A sea breeze is a daytime wind that blows from the sea onto the land, set up because the land warms faster than the water.
How it forms. In sunshine the land heats faster than the sea, so pressure near the ground falls slightly over the land. Cool marine air flows inland, rises at its leading edge (the sea-breeze front) and returns seaward aloft (Fig. 1; Miller et al. 2003).
As the front passes, the wind turns onshore and the temperature drops, most sharply in spring when the water is still cold. Marine air is usually more humid than inland air in summer but can be drier over cold spring water. The front can push tens of kilometers inland, and rising air along it can set off showers. A front that arrives a few hours earlier or later than expected can put a coastal forecast high off by 20 °F (11 °C), as in the case below.
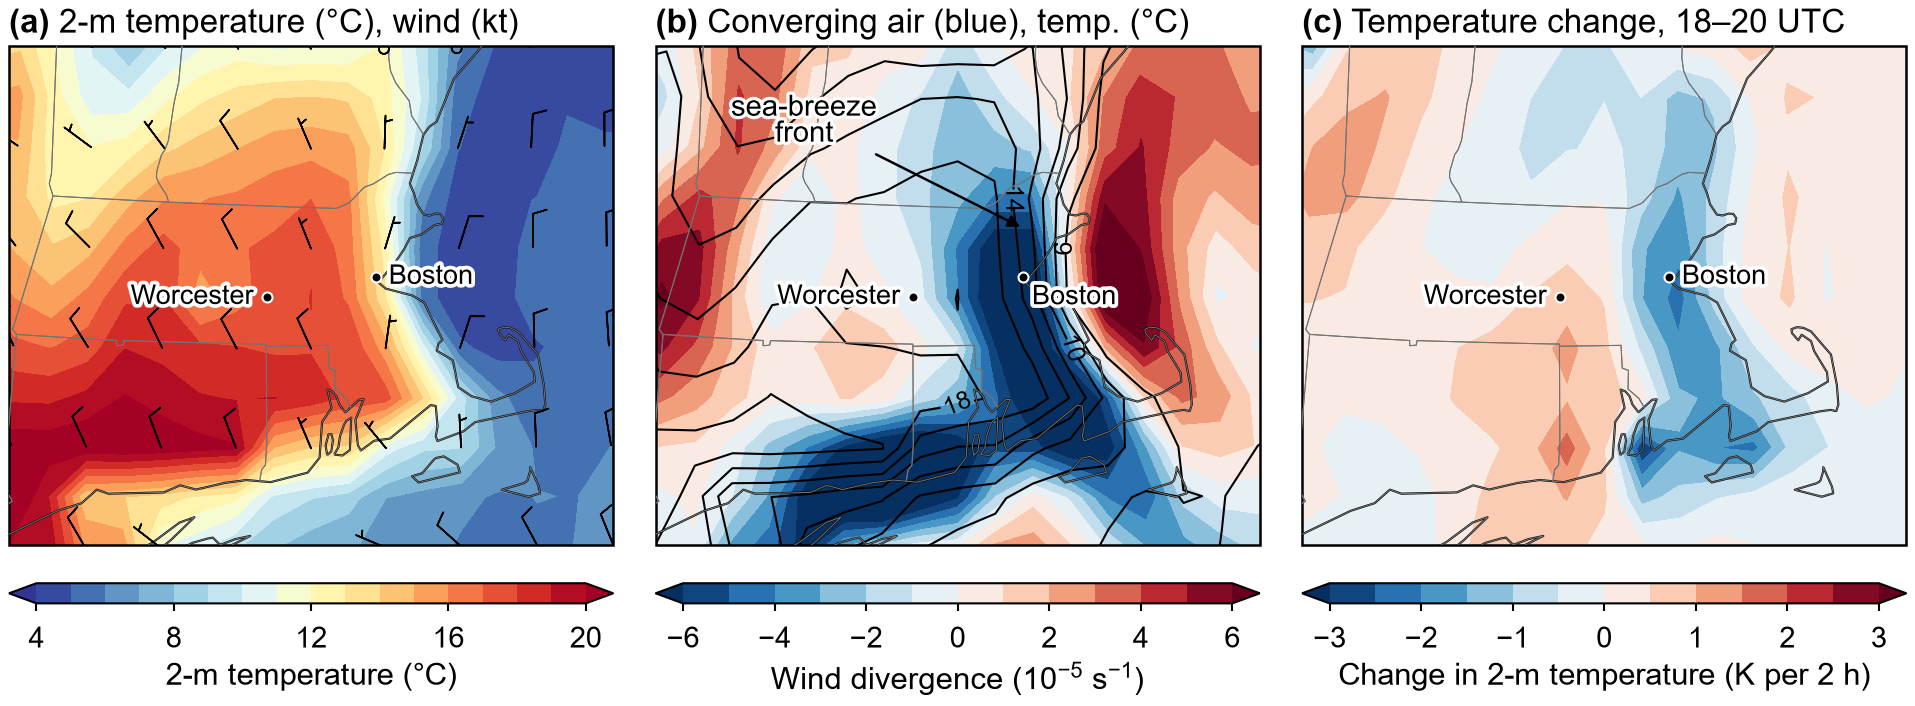
How forecasters identify it. The usual signals at coastal stations are an onshore wind shift and a temperature drop. The two do not always arrive together. When the large-scale wind is already blowing onshore, the change in temperature and humidity can run as much as 15 km ahead of the wind shift (Miller et al. 2003, citing Atkins et al. 1995 for Florida). In ERA5 the front of 27 March 2007 is a coastal band of converging wind (Fig. 2). At 1800 UTC (2 p.m. EDT) Boston was 4 °C (7 °F) colder and slightly drier than Worcester.
“Temperatures at 3 PM indicate a typical spring afternoon in southern New England...with readings well into the 60s across much of the region. The exception was across eastern coastal Mass where temps have cooled into the mid 40s courtesy of the seabreeze front.”
1.2 Backdoor cold front
A backdoor cold front is a cold front that arrives from the northeast, off the ocean, instead of from the west or northwest as most cold fronts do.
High pressure to the north or northeast, often over Quebec or the Canadian Maritimes, drives a northeast or east wind that carries cool, damp Atlantic air southwest along the coast in a shallow layer (Fig. 3).
At the surface. The wind swings to the northeast or east and the temperature can drop 10–30 °F (6–17 °C) within a few hours, often with low cloud, fog or drizzle, while places a few tens of kilometers inland stay warm. Backdoor fronts are most common in spring and early summer, when the ocean is still cold. Coastal forecast highs therefore depend on timing the front, and an error of a few hours can mean a miss of 20 °F (11 °C) or more.
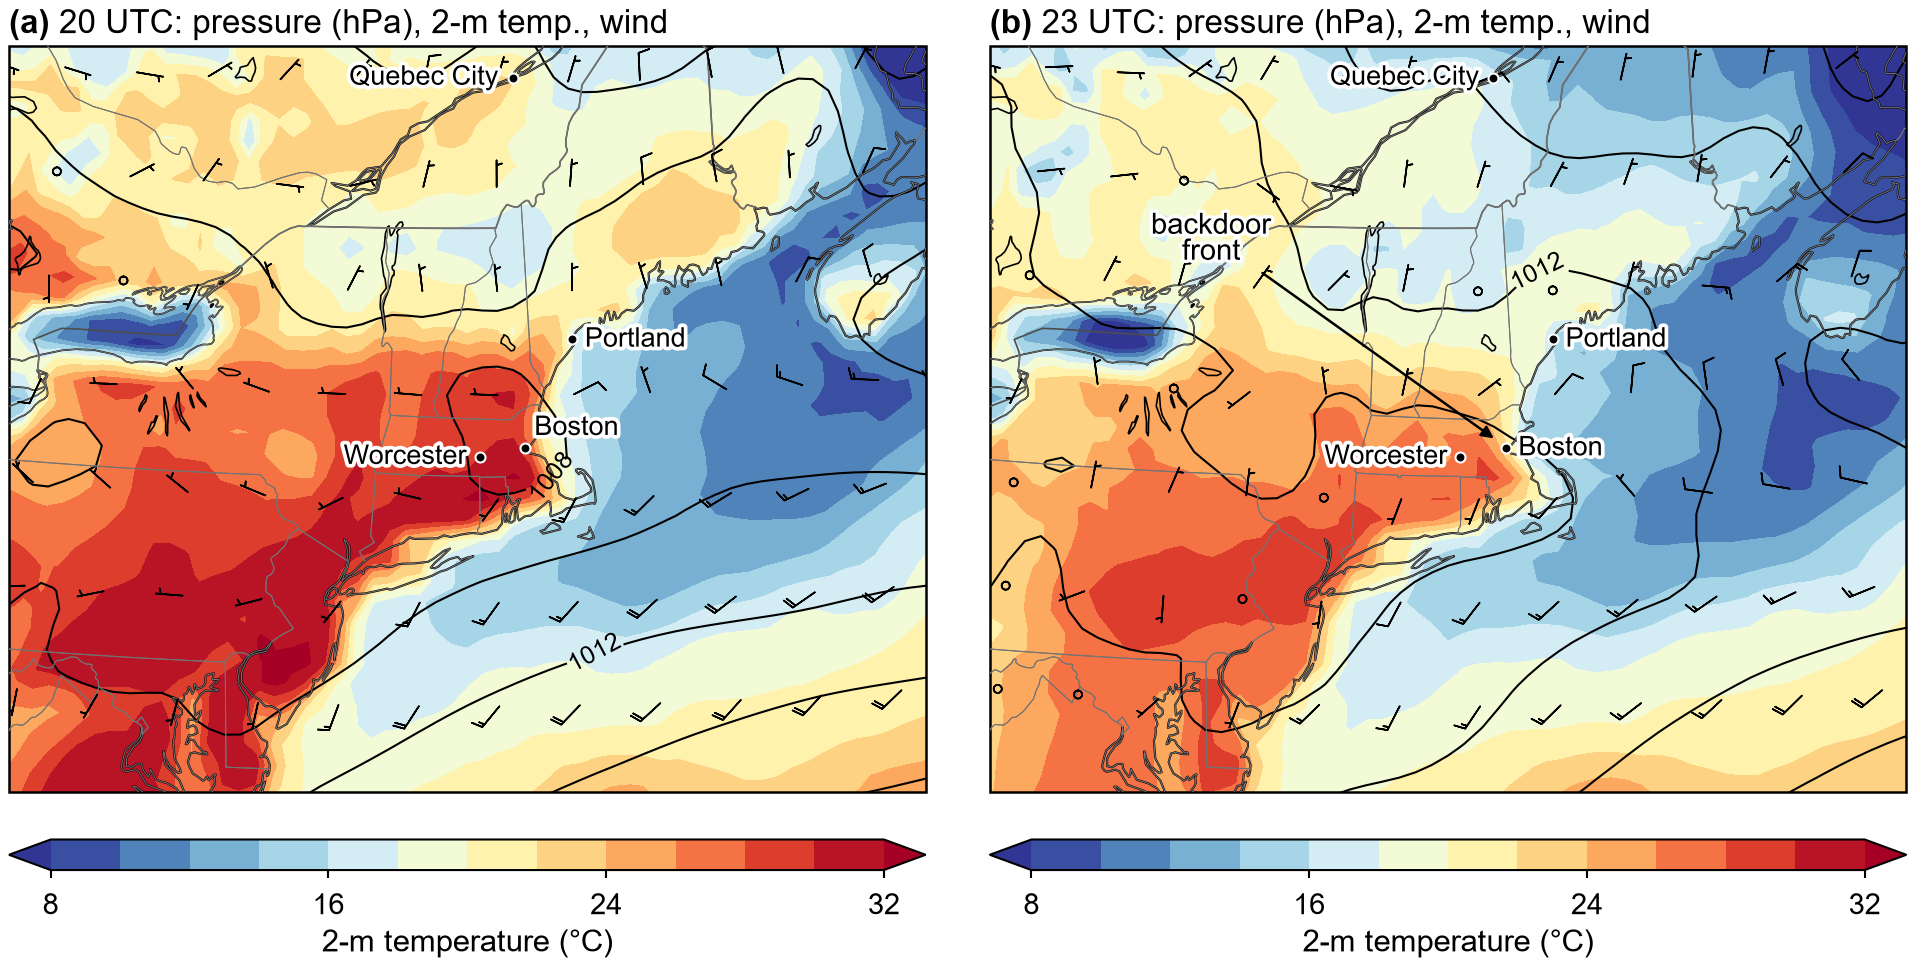
The front can be followed from station to station by the northeast wind shift and the temperature drop, with pressure rising behind it. The dewpoint can rise or fall, depending on the marine air.
On 26 May 2018 (Fig. 4) Boston’s airport cooled from 88 to 67 °F (31 to 19 °C) in two hours after 2054 UTC (4:54 p.m. EDT) as the wind turned northeast. Worcester, 60 km (40 mi) inland, stayed above 80 °F (27 °C), and Boston’s dewpoint did not change. ERA5 shows a smaller drop (6.4 °C in 3 h).
“Sea breeze aided backdoor front has already pushed through much of the BOS metro this evening and will continue to push SW through the evening.”
1.3 Coastal front
A coastal front is a shallow, nearly stationary boundary along or just off the coast in the cold season, between cold air over the land and milder air off the ocean.
How it forms. Every front Bosart (1975) studied formed with “a pronounced sea level cold anticyclone [high] to the north and east of New England.” Around that high the wind blows from the northeast over the ocean. Over land, the rougher surface slows the wind and turns it to blow more from the north, toward the coast. The two air masses are pushed together at the shore and the boundary between them sharpens (see also Nielsen 1989).
The cold air is usually less than 1 km deep, and the temperature can change by about 5–10 °C (9–18 °F) across 10 km (AMS 2026). The front often separates snow or ice inland from rain at the coast.
Why it matters for forecasts. A small shift in the front moves the rain–snow line across a town, and coastal lows tend to form along it or follow it (AMS 2026).
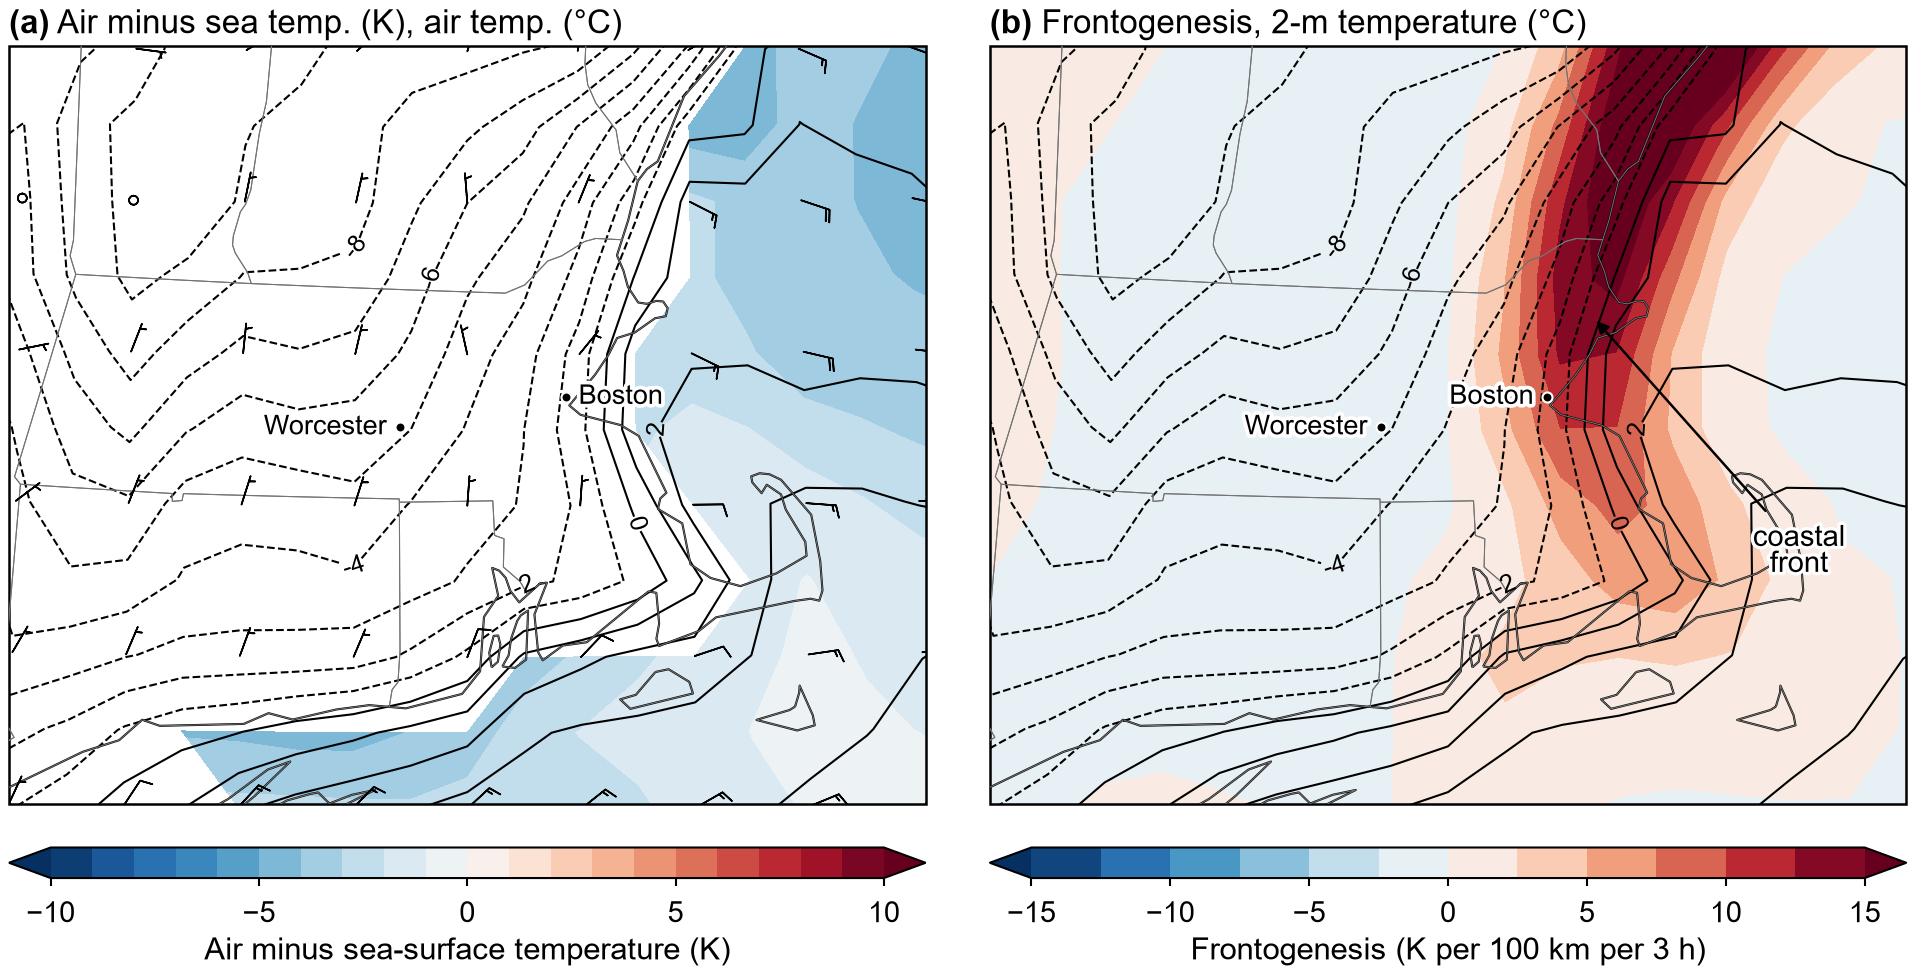
Comparing inland winds with those at coastal stations and buoys locates the front. Bosart (1975) found that the large-scale pressure pattern alone could not create a coastal front; friction and ocean heat were needed. In a 1981 storm, Keshishian and Bosart (1987) found that the observed winds also helped build it. In ERA5 at 1200 UTC 27 January 2008 (7 a.m. EST; Fig. 6) the front lies along the coast north of Boston, between east-southeasterly ocean air and north-northeasterly wind over below-freezing land.
“Caveat: coastal front developing /ESE wind at buoys/ may enhance snowfall rates in NE Mass N of Boston around 6 AM?”
1.4 Marine layer and sea fog
Sea fog forms when warm, moist air flows over colder water and is chilled from below to saturation; the cool, cloudy coastal layer it creates is often called the marine layer.
Off New England, southerly winds carry humid air over cold shelf water and the Gulf of Maine, cooling “the lower layer of air below its dewpoint” (AMS 2026). The chilled bottom layer, colder than the air above, forms an inversion that traps fog and low, flat stratus cloud (Fig. 7).
Effects. The shore is gray, damp and cool while inland is sunny and warm. Fog over land usually thins by late morning but can linger at the beach. It is most common in late spring and summer. The coastal high depends mostly on when the low cloud clears.
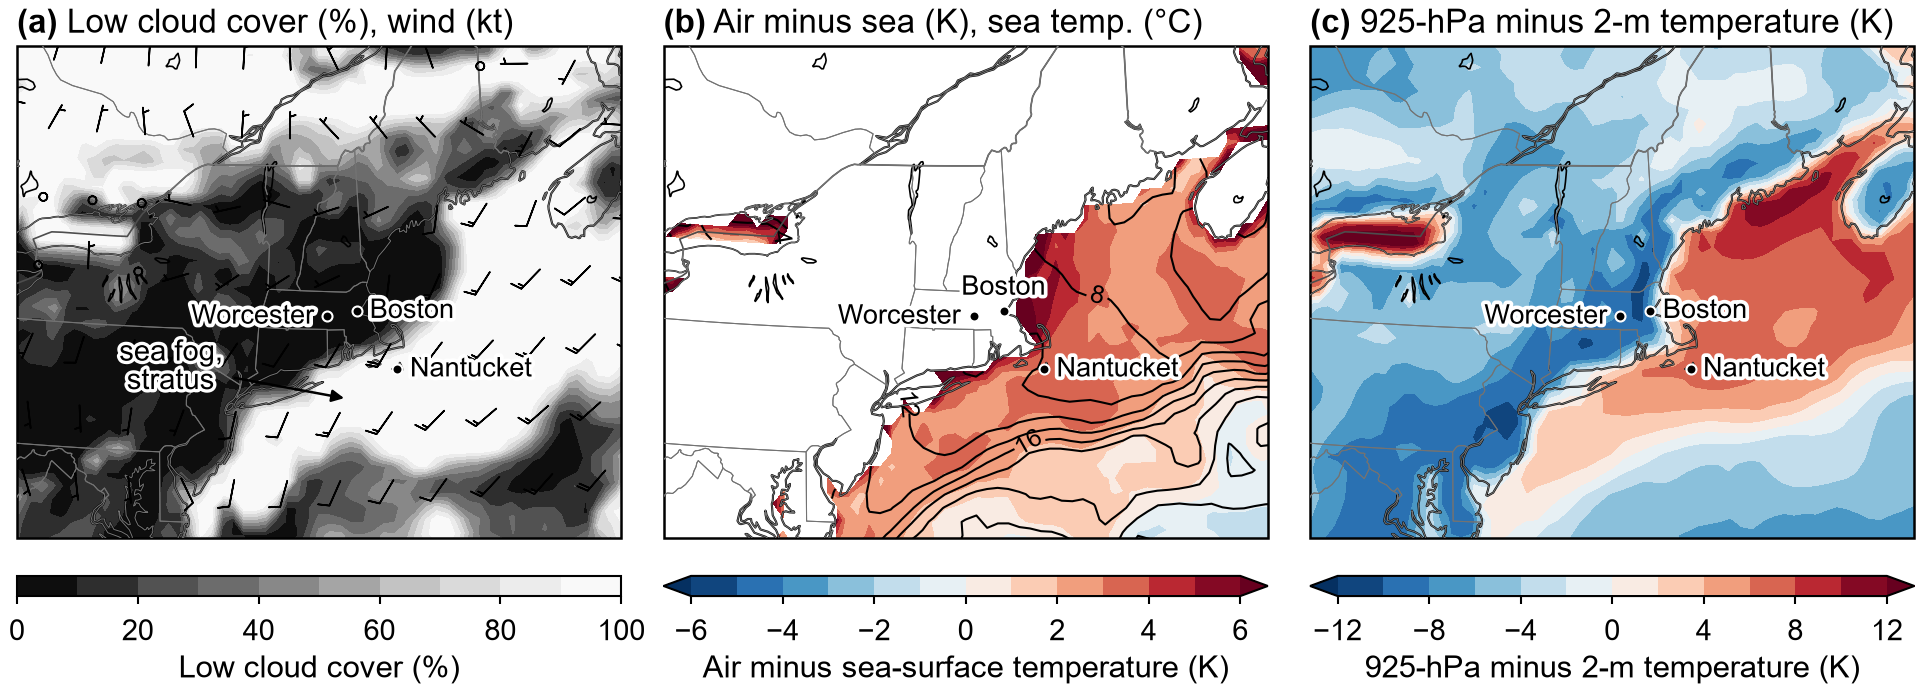
Fog and stratus are tracked on satellite images and in visibility and cloud-base reports from coastal stations and buoys. Fog is likely when the incoming air’s dewpoint is higher than the sea-surface temperature. Koračin et al. (2014) review marine fog worldwide.
On 10 May 2015 (Fig. 8) Boston reached 80–88 °F (27–31 °C), while Nantucket, in southwest wind off cold water, stayed at 57–62 °F (14–17 °C) in fog most of the afternoon, under cloud bases 200–300 ft (60–90 m) up. ERA5 has no fog variable; low cloud stands in for it.
“A narrow sliver of dense fog hugged the south coastal waters all afternoon.”
1.5 Nor’easter
A nor’easter is a strong coastal storm, named for the northeast winds it drives onto the coast north of its center.
In winter, air over the continent is much colder than air over the Gulf Stream. An upper-level trough (a southward dip in the jet stream about 5.5 km up) lifts the air ahead of it, and a low forms or strengthens along the coast, fed by heat released as water vapor condenses. Its counterclockwise winds draw cold air south on its west side and warm, moist air north on its east side (Fig. 9). Snow or rain is heaviest northwest of the track, and northeast winds push water onto east-facing shores. In the blizzard of 26–27 January 2015 (Fig. 10), Boston received 24.4 in (62 cm) and Worcester a record 34.5 in (88 cm).
Why it matters for forecasts. Forecasters compare a storm’s track with the “benchmark” at 40°N, 70°W, about 140 km (90 mi) south of Nantucket. Lows passing near it tend to bring heavy snow to eastern New England, and tracks closer to the coast bring rain. In 2015 New York City, at the western edge of the snow band, got about 10 in (25 cm), so a small difference in track separated a blizzard from a moderate snowfall.
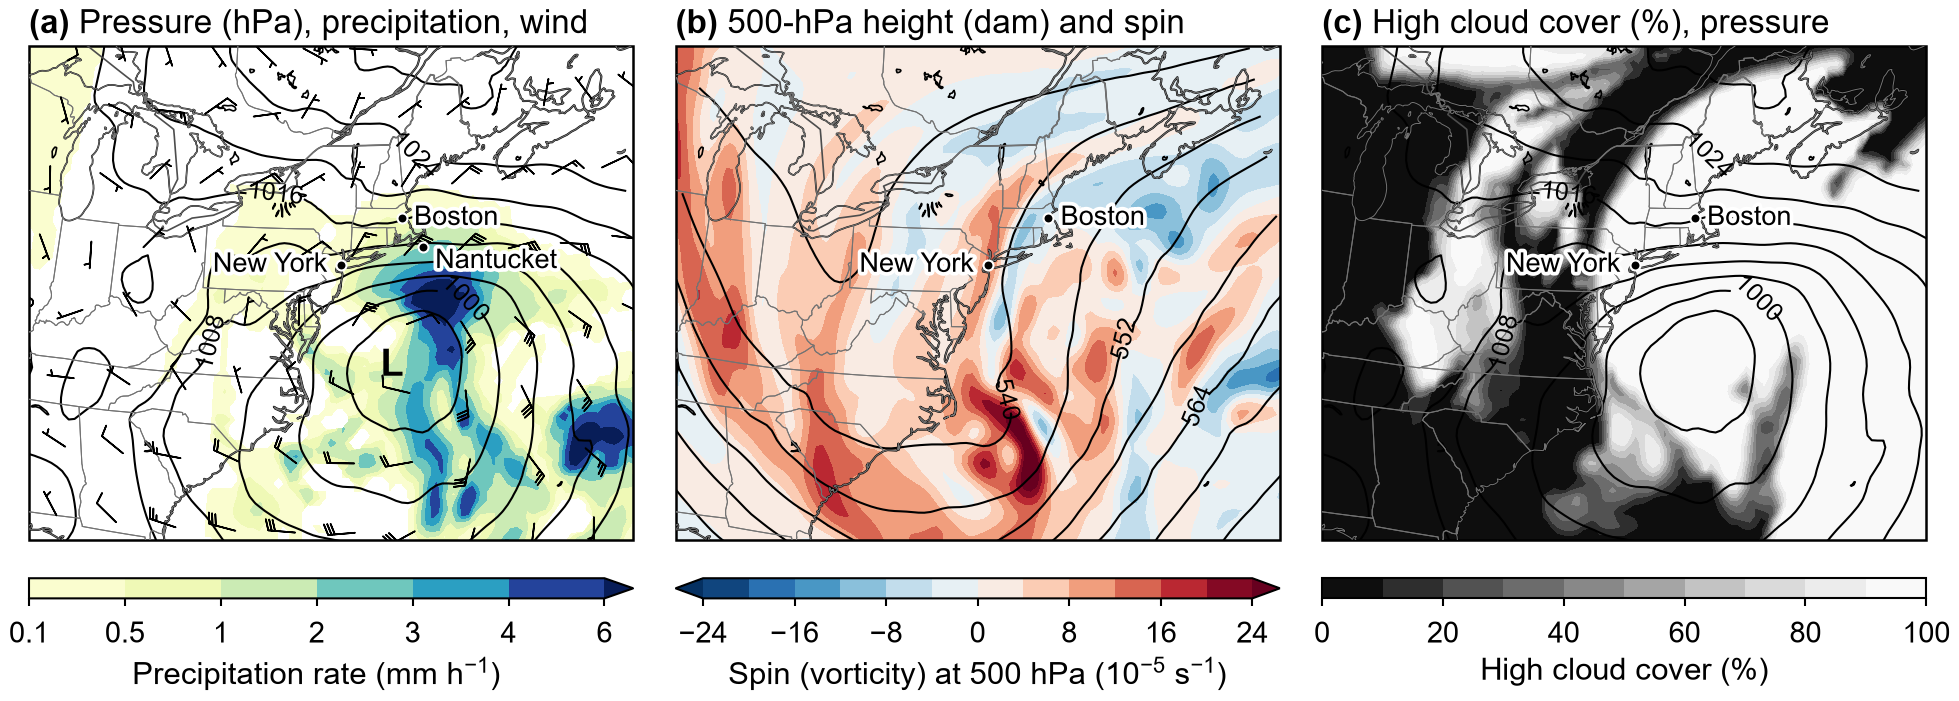
How forecasters identify it. The low is followed on pressure maps and satellite images. Miller (1946) classified East Coast storms (Section 1.6), and Kocin and Uccellini (2004) describe the Northeast’s major snowstorms.
“Coastal front currently west of I95 extending from between BED-BOS to NW RI. As sfc low approaches benchmark late tonight and Tue morning expect this front to move along and just east of the I-95 corridor with temps crashing into the teens and lower 20s in the coastal plain including BOS and PVD.”
1.6 Miller type B redevelopment
A Miller type B storm forms when a low moving in from the west weakens near the Appalachians and a new coastal low takes over.
How it forms. Miller (1946) sorted East Coast snowstorms into two types. In National Weather Service usage, type A develops along the Gulf or East Coast and moves up the coast as one storm; type B comes up the Ohio Valley, loses its compact center near the Appalachians and re-forms near the coast (NWS State College n.d.). The new low forms where the lift ahead of an upper-level trough meets the strong temperature contrast at the coast, often sharpened by a coastal front (Section 1.3) or by cold air dammed against the mountains (Section 2.1; Fig. 11).
Effects. Precipitation often eases during the handoff, then returns heavily north and west of the new low, so the timing and position of the new low decide which towns get the most snow.
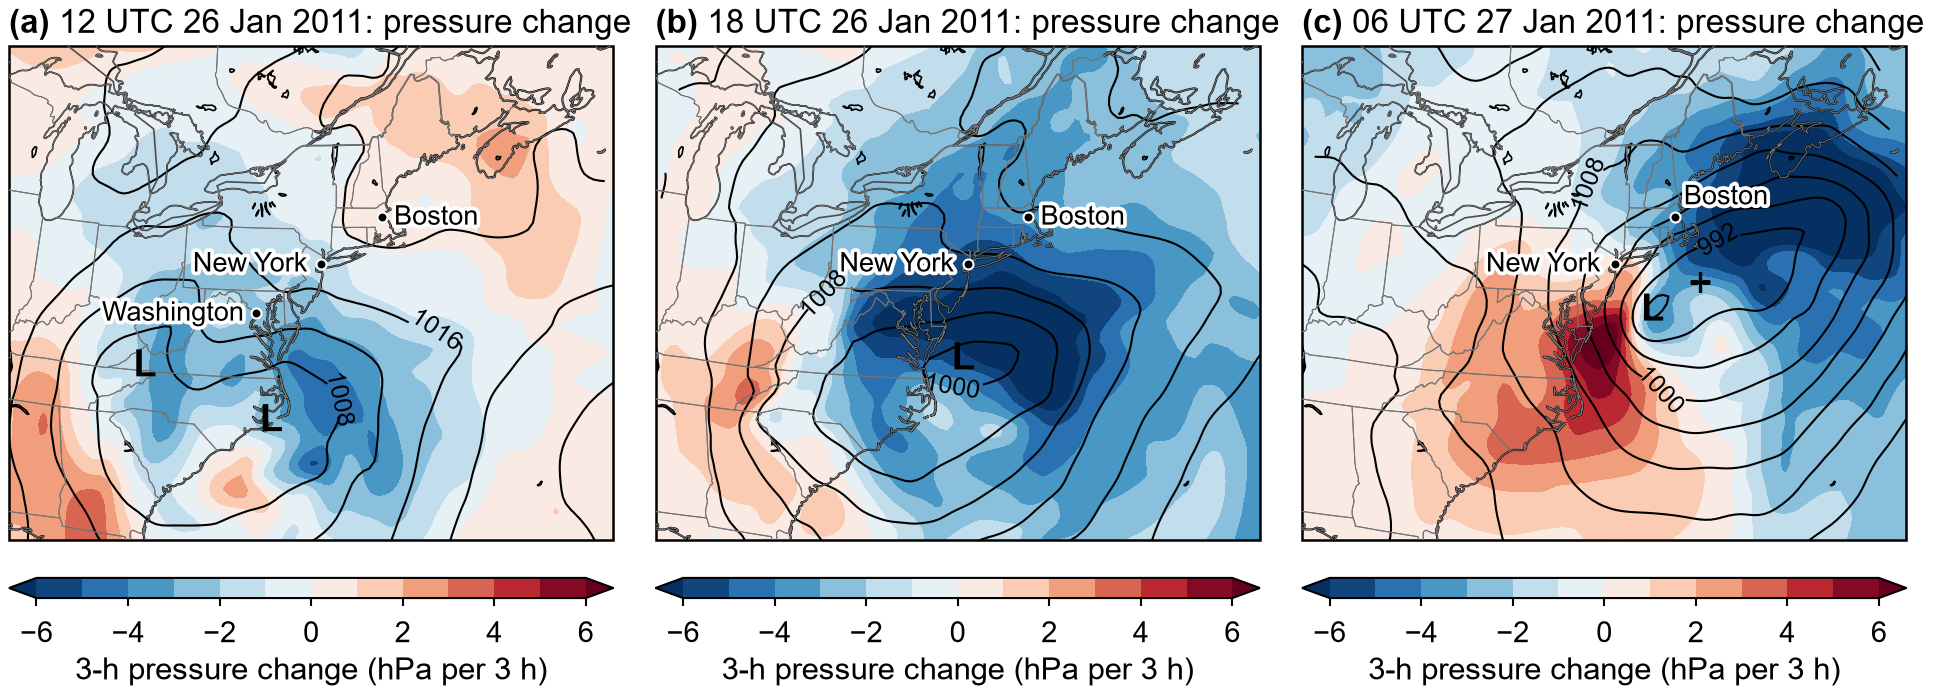
The handoff shows as pressure falling at the coast while it rises at the inland low. The storm of 26–27 January 2011 (Fig. 12) illustrates the handoff, although its first low came from northern Alabama rather than the Ohio Valley. At 1200 UTC 26 January (7 a.m. EST) ERA5 has weak lows west of the Appalachians and on the North Carolina coast; by 1800 UTC only the coastal low remains. The two Philadelphia discussions below, issued under four hours apart, record the same jump, placing the low first over northern Alabama and then over coastal North Carolina.
“Low pressure over northern Alabama early this morning will track northeast and deepen as it moves off the Mid Atlantic coast this evening.” (6:58 a.m. EST)
“Low pressure over coastal North Carolina this morning will track northeast and deepen as it moves off the Mid Atlantic coast this evening.” (10:36 a.m. EST)
2. Terrain-forced systems
Mountains and large lakes change the air that flows over or past them. The Appalachians and the New England hills hold back cold air or warm the air that descends from them, and the Great Lakes supply the heat and moisture for lake-effect snow.
2.1 Cold-air damming
Cold-air damming is shallow cold air held against the eastern Appalachians by high pressure to the north, as a dam holds water.
How it forms. High pressure to the north drives cold, dense air toward the mountains, where it turns south along the slope (Ellis et al. 2018); Earth’s rotation presses it against them. Rain from the warm air above evaporates in the dome, supplying roughly 30% of the cooling in places (Bell and Bosart 1988).
Effects. The dome brings overcast skies, a northeast wind, drizzle and temperatures far below normal. It is most common in Virginia and the Carolinas but also occurs in New England. In a below-freezing dome the rain freezes on contact (Section 4.1).
Why it matters for forecasts. Models tend to erode the dome too early, in one case by more than 10 °F (6 °C) (Riordan et al. 2003).
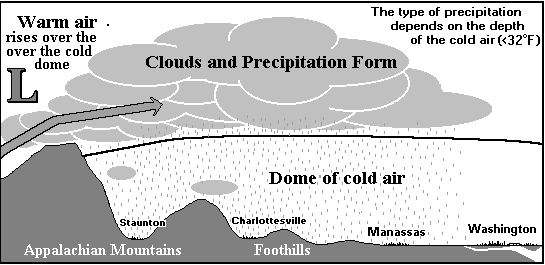
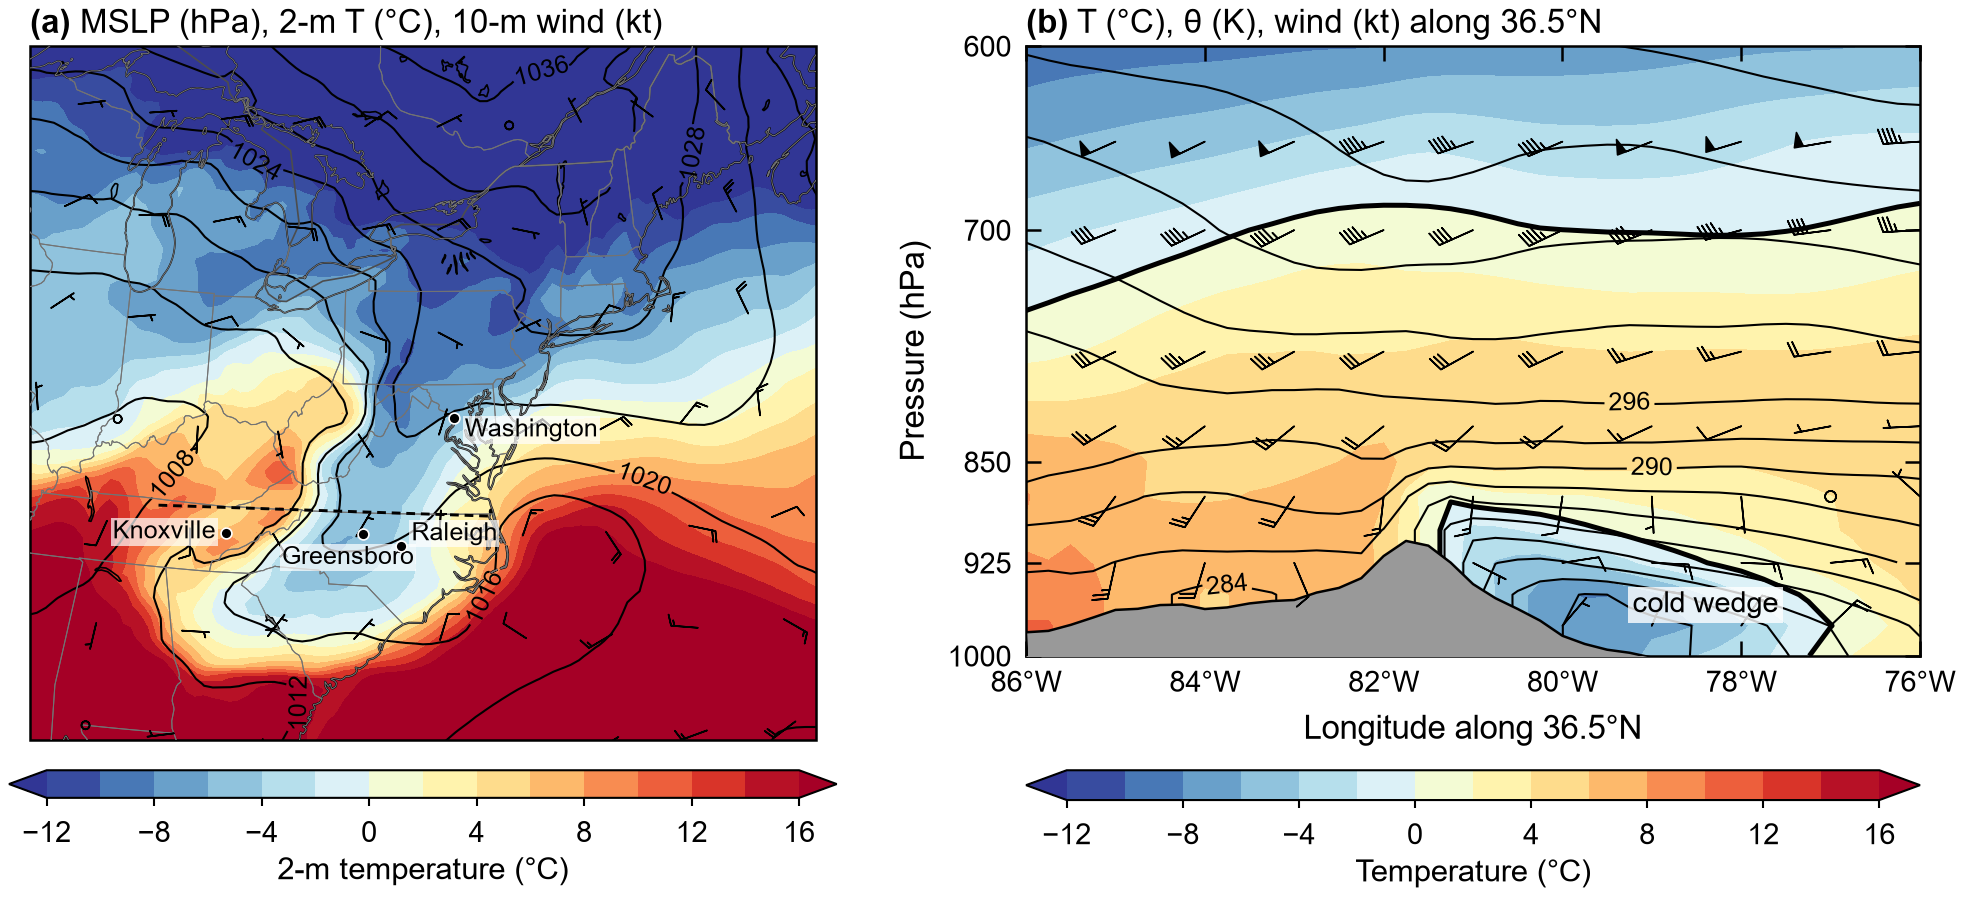
How forecasters identify it. Classically, isobars and lines of equal temperature bend south in a U along the mountains (Bell and Bosart 1988). The dome lies below 850 hPa, so maps at that level barely show it (Ellis et al. 2018).
On 26 January 2004 (Fig. 14), high pressure over Quebec pushed cold air south, bending the isobars into a U over Virginia and the Carolinas. At 1 p.m. EST Greensboro, N.C., was 21 °F (−6 °C) in a northeast wind, while Knoxville, Tenn., west of the mountains, was 47 °F (9 °C). At 1.5 km the air was 43 °F (6 °C), so rain froze on contact.
“Another shot of wintry weather this aftn [afternoon]-tonight...and not the kind that is friendly to power lines or trees. Looking at significant icing (a quarter inch or more) generally east of the Blue Ridge. […] Temps today will struggle to reach 30 [°F]...except outside the wedge. Higher ridges in the SW [southwest] could exceed 40 as 8H [850-hPa] temps rise to +7 [°C].”
2.2 Downslope (lee) warming
Downslope warming is the heating of air as it sinks down the lee (downwind) side of a mountain range, making places beyond them warmer and drier.
How it forms. Sinking air is compressed and warms about 10 °C per kilometer (5.5 °F per 1000 ft). Rising air cools at that rate only until clouds form; then condensation releases heat, so air that rains out upwind reaches the lee warmer and drier. Even without rain, air brought down from ridge height usually arrives warmer than the air near the ground upwind.
The result is a dry, gusty westerly wind, a falling dewpoint and an afternoon high a few degrees above what the air mass alone would give. In New England the westerly wind also holds off the sea breeze (Section 1.1), so even east-facing beaches get hot, and the dry, gusty air raises the risk of brush fires.
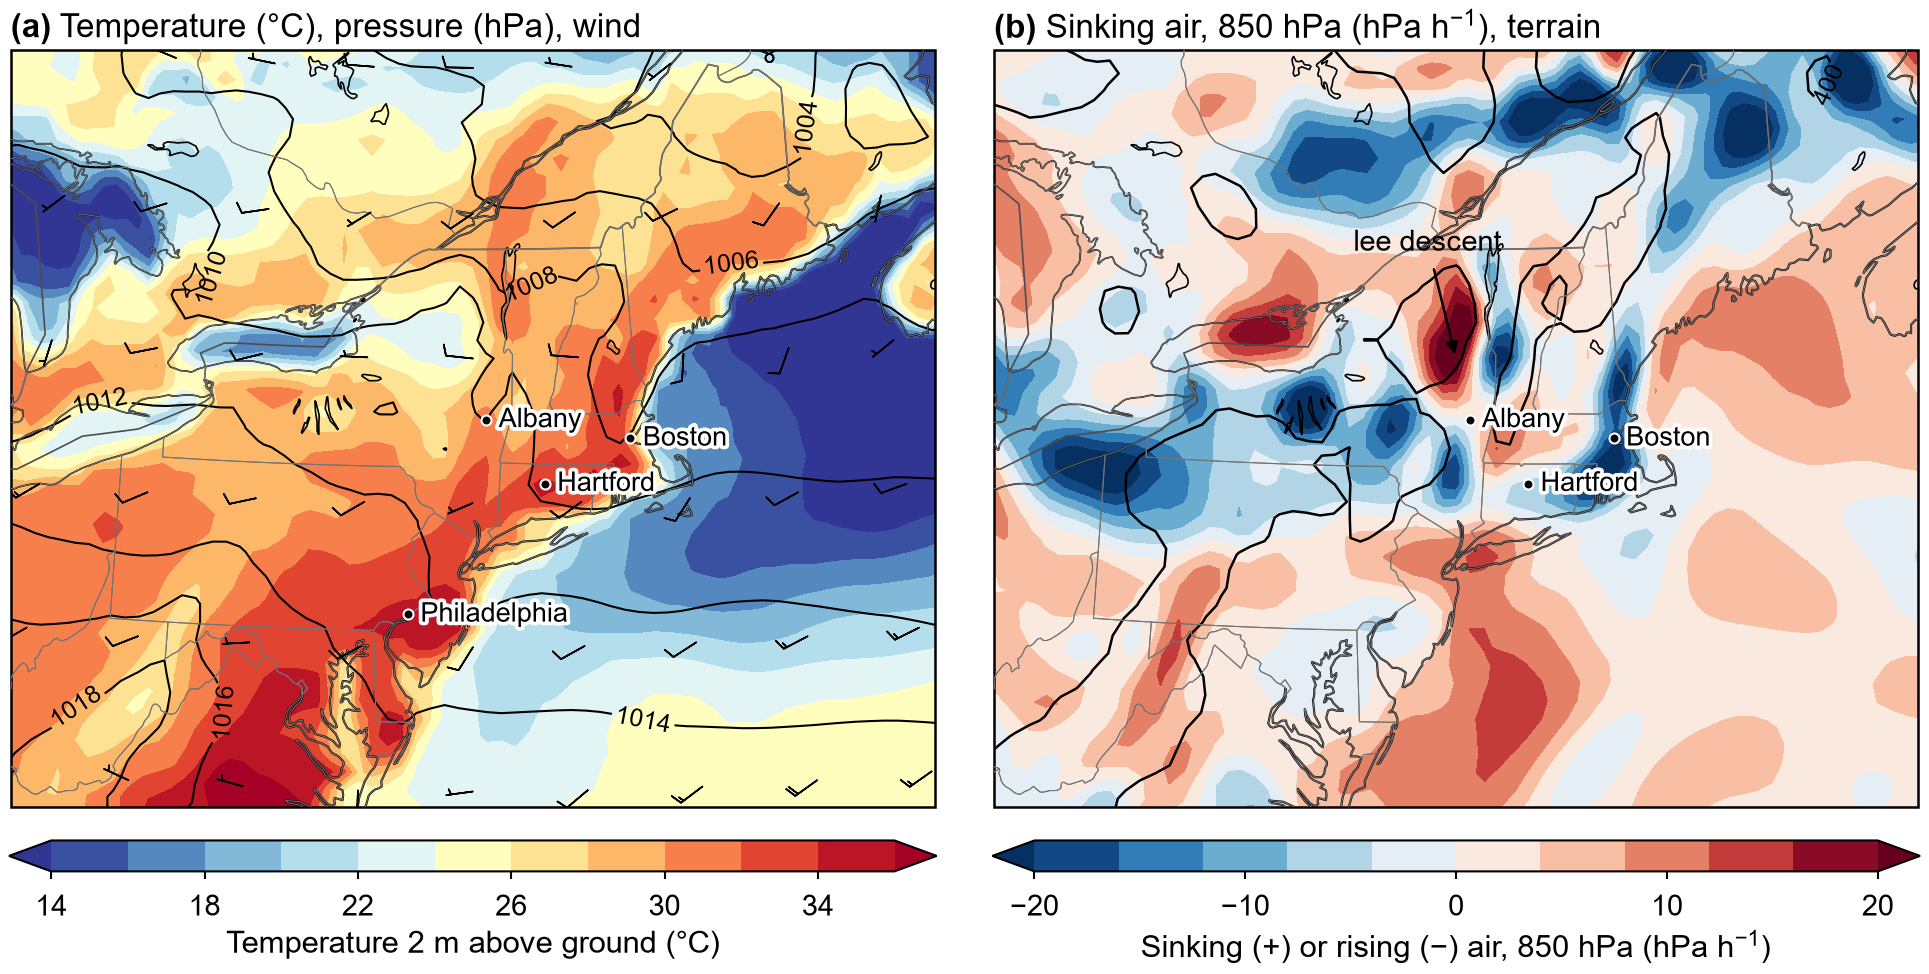
Forecasters look for westerly or northwesterly wind across the ridges, dewpoints that fall during the afternoon, and warm air near 850 hPa (about 1.5 km up) that mixing can bring down. The heat wave of 8 June 2008 (Fig. 16; 1800 UTC, 2 p.m. EDT) had westerly wind at 850 hPa, sinking air in the lee of the Adirondacks and Catskills and no sea breeze, so Boston reached 87 °F (30 °C). The dewpoint and the air aloft changed little that day.
“Highs for today were nudged upward a few degrees...since temperatures have not dropped off much overnight and W [westerly] downsloping flow is expected. In addition...many of E [east] coast beaches will be hotter today since we will have enough of a [pressure] gradient to prevent sea breezes from developing.”
2.3 Lake-effect snow
Lake-effect snow falls in narrow, intense bands downwind of the Great Lakes when very cold air blows across lake water that is still unfrozen and much warmer than the air.
Cold air crossing open water is heated from below and gains moisture, so it rises in snow-shower clouds that line up with the wind. The longer the path over water (the fetch), the more heat and moisture the air gathers; an inversion higher up caps the clouds.
Snowfall. Snow depth can vary by 100 cm (40 in) within 50 km (30 mi) (Niziol 1987). On 18 November 2014 a band off Lake Erie stalled over Buffalo’s southern suburbs; snow fell at about 4 in (10 cm) per hour and passed 4 ft (1.2 m) locally. Because a small shift in wind direction moves the band, one town can get a dusting while the next gets several feet.
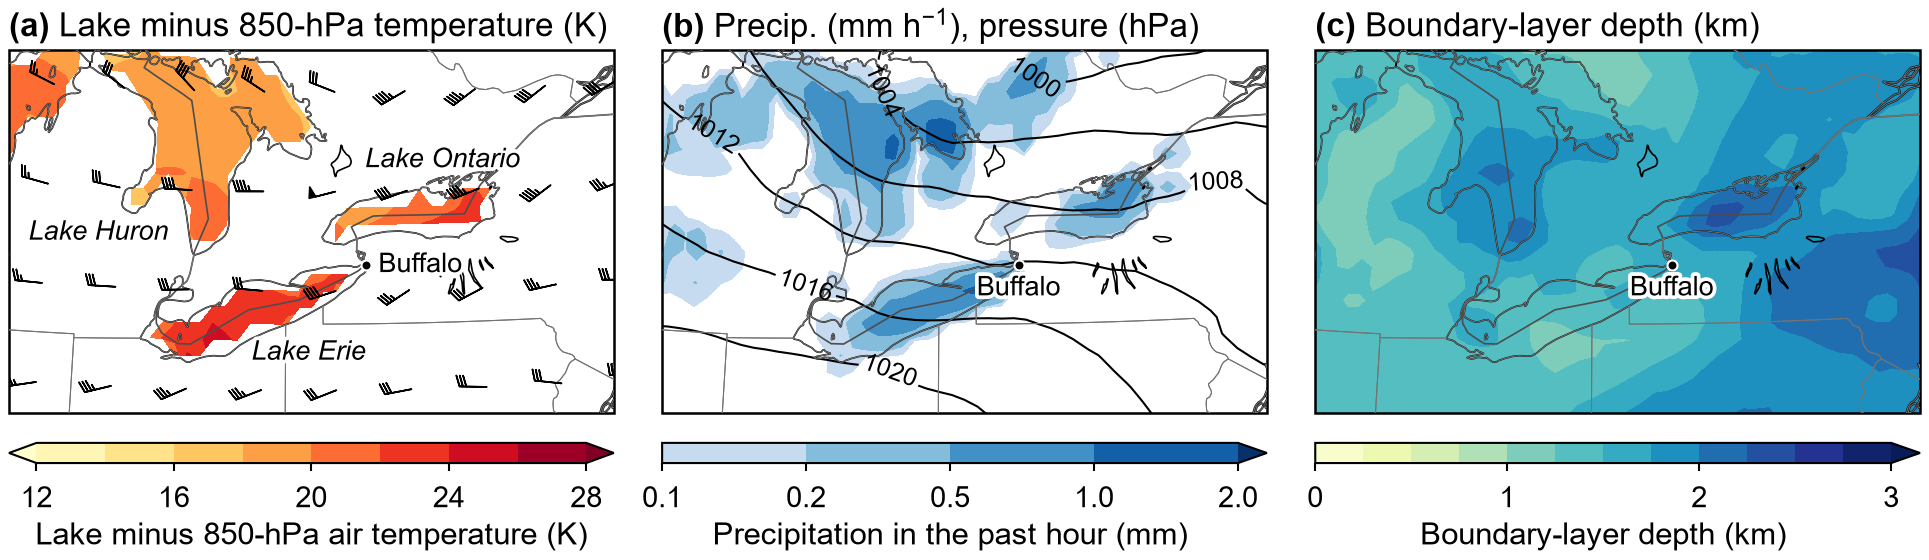
How forecasters identify it. The Buffalo NWS office’s guidance combined low-level temperature and wind, fetch, the turning of the wind with height, and lake temperature (Niziol 1987). A common rule of thumb asks for the lake to be at least about 13 °C (23 °F) warmer than the air at 850 hPa, about 1.5 km up (Niziol et al. 1995). ERA5’s 25–30 km grid shows the setting of a band but not the band itself. In Fig. 18a, at 2100 UTC (4 p.m. EST) 18 November 2014, the lake was about 23 °C (41 °F) warmer than the air at 850 hPa over Lake Erie, and the wind blew along the lake toward Buffalo.
“The northern edge of this lake effect band is so sharply defined that snow amounts across the town of Cheektowaga range from just a few inches on the north side...to 4 feet across the southern portion of the town.”
3. Boundary layer and radiation
The boundary layer is the lowest one to two kilometers of the atmosphere, the part stirred by contact with the ground. How it heats by day and cools by night accounts for much of the error in forecasts of the daily high and low temperature.
3.1 Radiational cooling and cold pools
On clear, calm nights the ground loses heat by radiating it to space, the air touching the ground cools, and the coldest air collects in valleys and low spots.
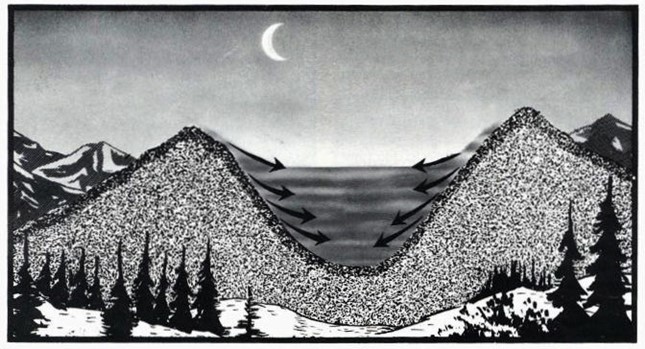
All surfaces radiate heat as infrared light. Clouds and water vapor send some of it back, so under a clear, dry sky the ground loses far more. With light wind an inversion forms and the surface air decouples, meaning that turbulence dies and the layers stop mixing. Dense cold air drains downhill and pools in valleys, and fresh snow deepens the chill.
Temperatures can differ by 10 °F (5–6 °C) over a few miles; hilltops, cities and windy spots stay milder. At 0900 UTC (4 a.m. EST) 6 January 2016 (Fig. 20) the air 400 m up was 5–10 °C warmer than at the ground over much of the interior, and the coldest ERA5 grid box, in the upper Connecticut River valley, was −11 °F (−24 °C).
Why it matters for forecasts. At 210 U.S. airports in winter 2019–20, on mostly clear days, the GFS (the NWS global model) ran about 1 °C (2 °F) too warm at night and 2 °C (4 °F) too cold by day (Patel et al. 2021). In a cloudy cold pool, older versions of the HRRR, an NWS model with a 3-km grid, ran too cold because they made too little low cloud (Adler et al. 2023).
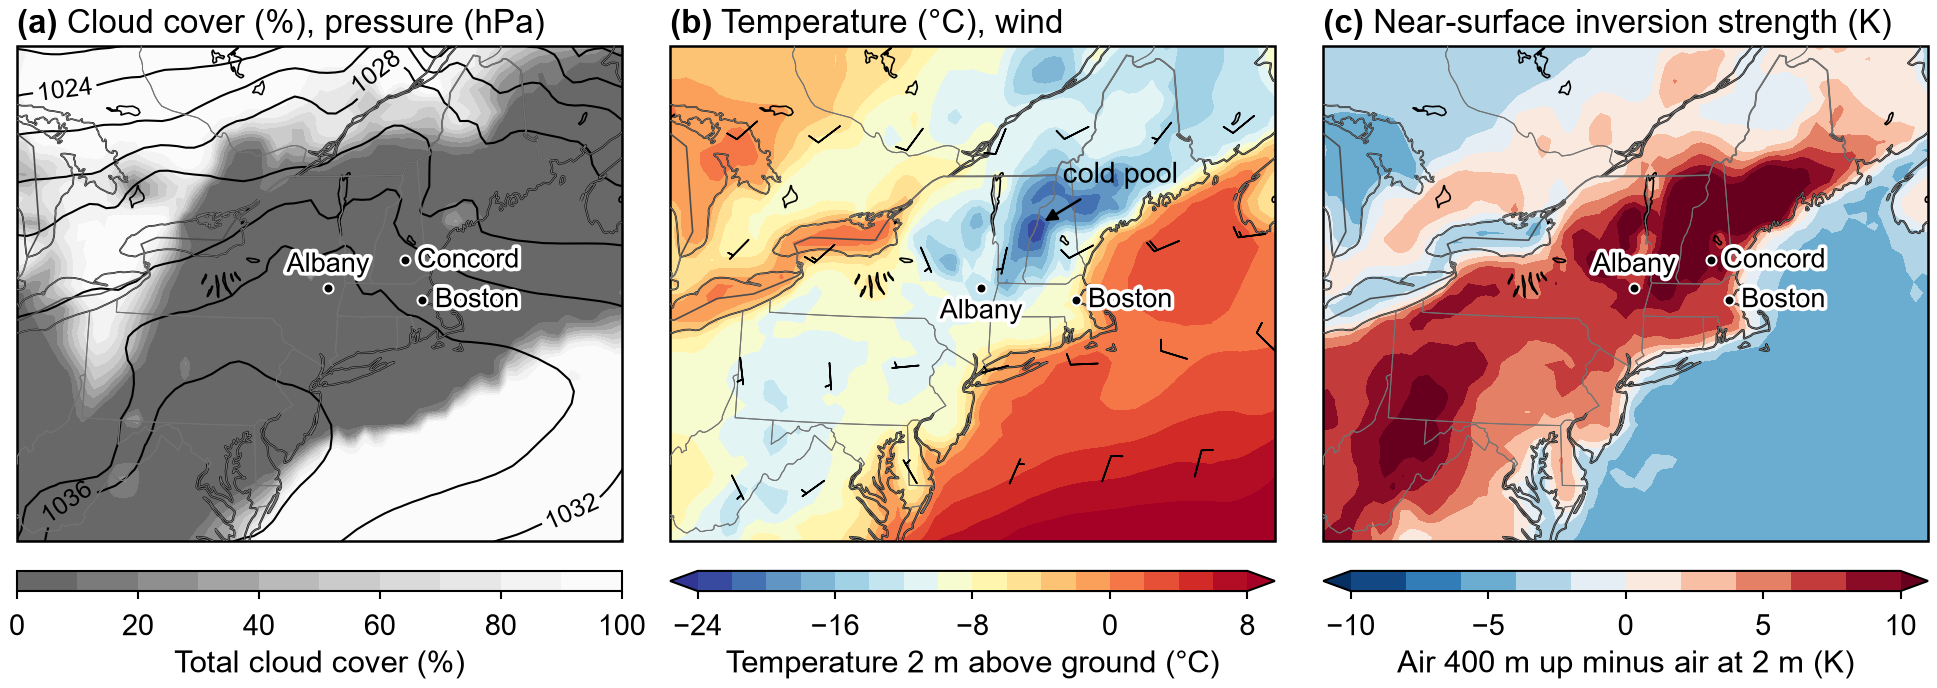
Forecasts of the overnight low weigh cloud, wind, snow cover and the dewpoint, which sets a floor on the night’s low because dew or fog forms near it.
“High pressure overhead along with clear skies/light winds was leading to an ideal night of radiational cooling. Low temps across many outlying locations will bottom out well down into the single digits. […] Coldest readings at 9 PM extended from Plymouth...to Falmouth and Marthas Vineyard...where that narrow swath of ocean effect snow cover was assisting in the radiational cooling. Meanwhile...continued mid level warm advection will hold overnight low temps generally in the 15 to 20 degree range across the typical non-decoupling locations of Worcester and Boston.”
3.2 Morning inversion and mixing out
After a cold night, cold air often lies at the ground under warmer air until the sun’s heating stirs the two together, which forecasters call mixing out.
At dawn an inversion often fills the lowest few hundred meters, left by nighttime cooling (Section 3.1) or by trapped cold or ocean air. Sunlight heats the ground, and rising warm bubbles build a mixed layer that grows into the inversion from below (Stull 1988). Once it reaches the top, warmer air from above mixes down. The temperature can sit flat under fog or low cloud, then jump several degrees in an hour once it clears. If heating cannot break the inversion, the day stays gray.
The afternoon high therefore depends on when the inversion breaks, a timing that models find hard to predict. Five versions of a high-resolution forecast model, tested against spring balloon soundings in the central United States, all made the morning layer too cool and dry (Coniglio et al. 2013).
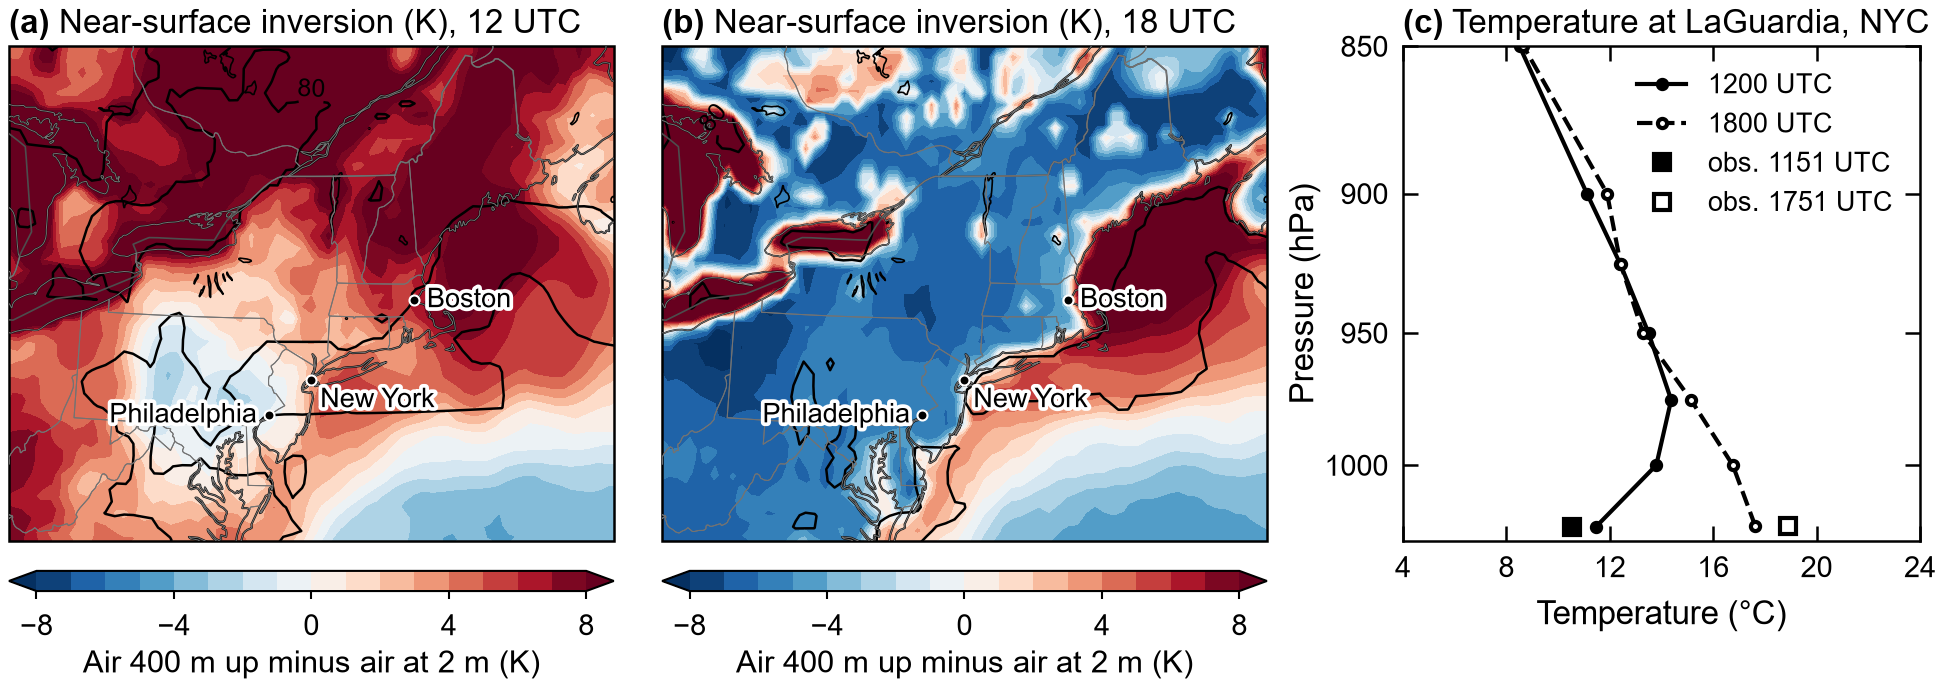
The 1200 UTC (8 a.m. EDT) balloon sounding shows the inversion. Forecasters estimate the high from the temperature at the level where mixing should top out, often 925 or 850 hPa, adding about 10 °C for each kilometer the air descends to the ground.
On 20 March 2012 (Fig. 22) fog lay under an inversion over New York City. LaGuardia Airport stayed at 51–52 °F (11 °C) until 9:51 a.m. EDT, rose 7 °F (4 °C) in the hour to 11:51 a.m. as the fog cleared, and reached 72 °F (22 °C) by 2:51 p.m.
“There is an inversion above the surface up to around 950 mb. Light southeasterly flow helps trap moisture beneath this inversion. […] We start to mix out towards afternoon once inversion breaks. This would promote increased daytime warmth as cloud cover decreases. This timing will be crucial for max temp forecast today...potentially higher or lower depending on when exactly the low clouds and fog scatter out.”
3.3 Overrunning and the midnight high
Overrunning is warm air flowing over colder air at the ground, usually ahead of a warm front; if warm air keeps arriving overnight, the day’s high can come near midnight.
How it forms. A warm front is the leading edge of advancing warm air, which, being lighter, slides up over the cold air. This warm advection (warm air carried in by the wind) continues after sunset. The surface warms when the front passes, or sooner if wind mixes the warm air down.
Climatology. In December–February 2000–2023 (hourly airport data), the day’s high came in the last hour of the day on 8% of days at Boston and 10% at New York. Highs in the first hour, followed by falling temperatures (usually behind a cold front), were more common: 12% and 14%. Together, about one winter day in five at Boston (20%) and one in four at New York (24%) had its high within an hour of midnight. A daily-high forecast must therefore cover the whole calendar day, midnight to midnight local standard time.
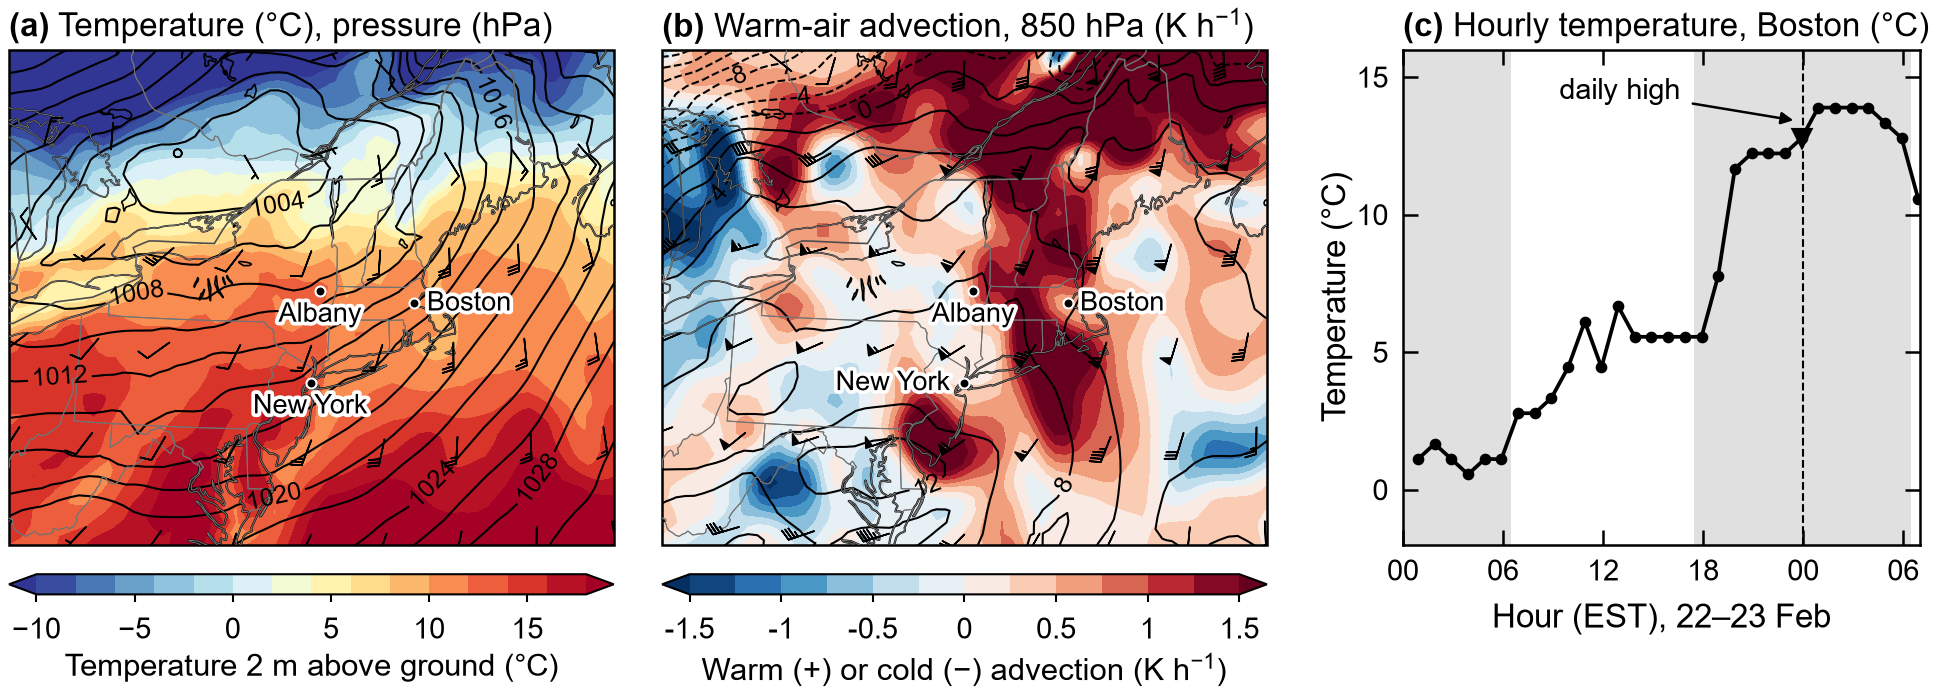
The signal at 925 or 850 hPa is wind blowing from warmer toward colder areas, as in Fig. 24b. Forecasters also track the warm front and any low-level jet (Section 3.4).
On 22 February 2022 (Fig. 24) Boston stayed near 42 °F (6 °C) all afternoon, rose to 53 °F (12 °C) between 6 and 8 p.m. EST as the warm front passed, and kept warming in strong south-southwesterly wind aloft, reaching the day’s high, 55 °F (13 °C), at 11:54 p.m.
“Lastly, will see non-diurnal temperature trend due to the strong warm air advection as we are within the warm sector. […] Temperatures will increase as the night progresses with most in the 50s after midnight.”
3.4 Nocturnal low-level jet
A nocturnal low-level jet is a band of fast wind a few hundred meters above the ground that forms at night while the air at the ground is calm.
How it forms. Because Earth rotates, moving air is deflected to the right in the Northern Hemisphere. The geostrophic wind is the wind at which this deflection exactly balances the push from high to low pressure. By day, turbulence acts like friction and holds the low-level wind below that speed. After sunset an inversion (Section 3.1) cuts the air above it off from the ground. Freed from friction, the wind swings around the geostrophic wind in speed and direction, an inertial oscillation lasting about 18 h at New England’s latitude (12 h divided by the sine of the latitude), and for part of the night the wind is faster than the geostrophic wind (Blackadar 1957; Van de Wiel et al. 2010).
With southerly flow the jet carries warm, moist air north and can feed storms at night. Its strength in a forecast depends on how the model handles nighttime mixing.
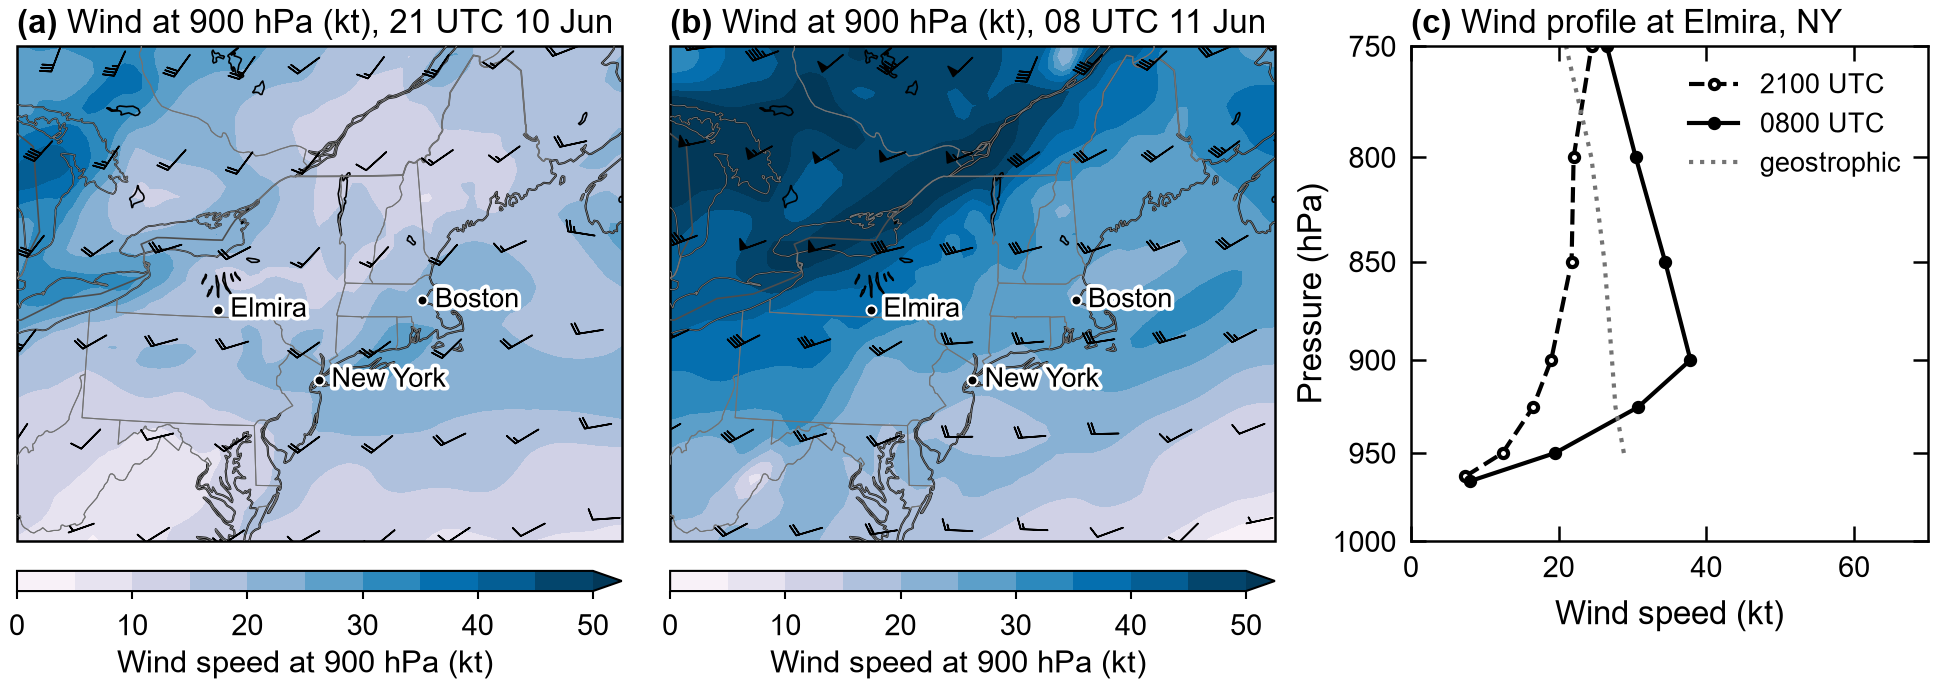
Forecasters compare wind profiles of the lowest 1–2 km, from Doppler radar, wind profilers (upward-pointing wind radars), lidar (laser radar) or balloons, with the geostrophic wind.
On the clear night of 10–11 June 2017 (Fig. 26), ERA5’s wind at Elmira, N.Y., 600 m above the ground rose from 19 kt at 2100 UTC (5 p.m. EDT) to 38 kt at 0800 UTC (4 a.m.), faster than the geostrophic wind (27 kt); at the ground it stayed near 8 kt.
“Mostly clear night foreseen, with decoupling wind at the surface as southwesterly low level jet develops just aloft.” […] “...a developing 34-38 knot low level jet around 2 kft agl out of the west-southwest as warm air overspreads the region.”
4. Winter precipitation and rapidly deepening cyclones
In winter, thin layers of air a little above or below freezing decide whether precipitation reaches the ground as snow, sleet, freezing rain or rain. The strongest winter storms also deepen unusually fast.
4.1 Freezing rain and ice storms
Freezing rain is rain that falls through shallow below-freezing air near the ground and freezes on contact with cold surfaces, coating them in ice.
Falling snow melts in a layer warmer than 0 °C (32 °F), the warm nose, usually 1–3 km up. Below lies a shallow below-freezing layer, often cold air dammed against the Appalachians (Section 2.1). If that layer is thin, the drops cool below 0 °C but stay liquid (supercooled) and freeze on contact. If it is deeper, they refreeze into ice pellets (sleet).
Effects. Rain falls at 28–32 °F (−2 to 0 °C) and freezes on every surface; a quarter inch (6 mm) or more brings down branches and power lines. A change of a degree or two in either layer can turn freezing rain into sleet or plain rain.
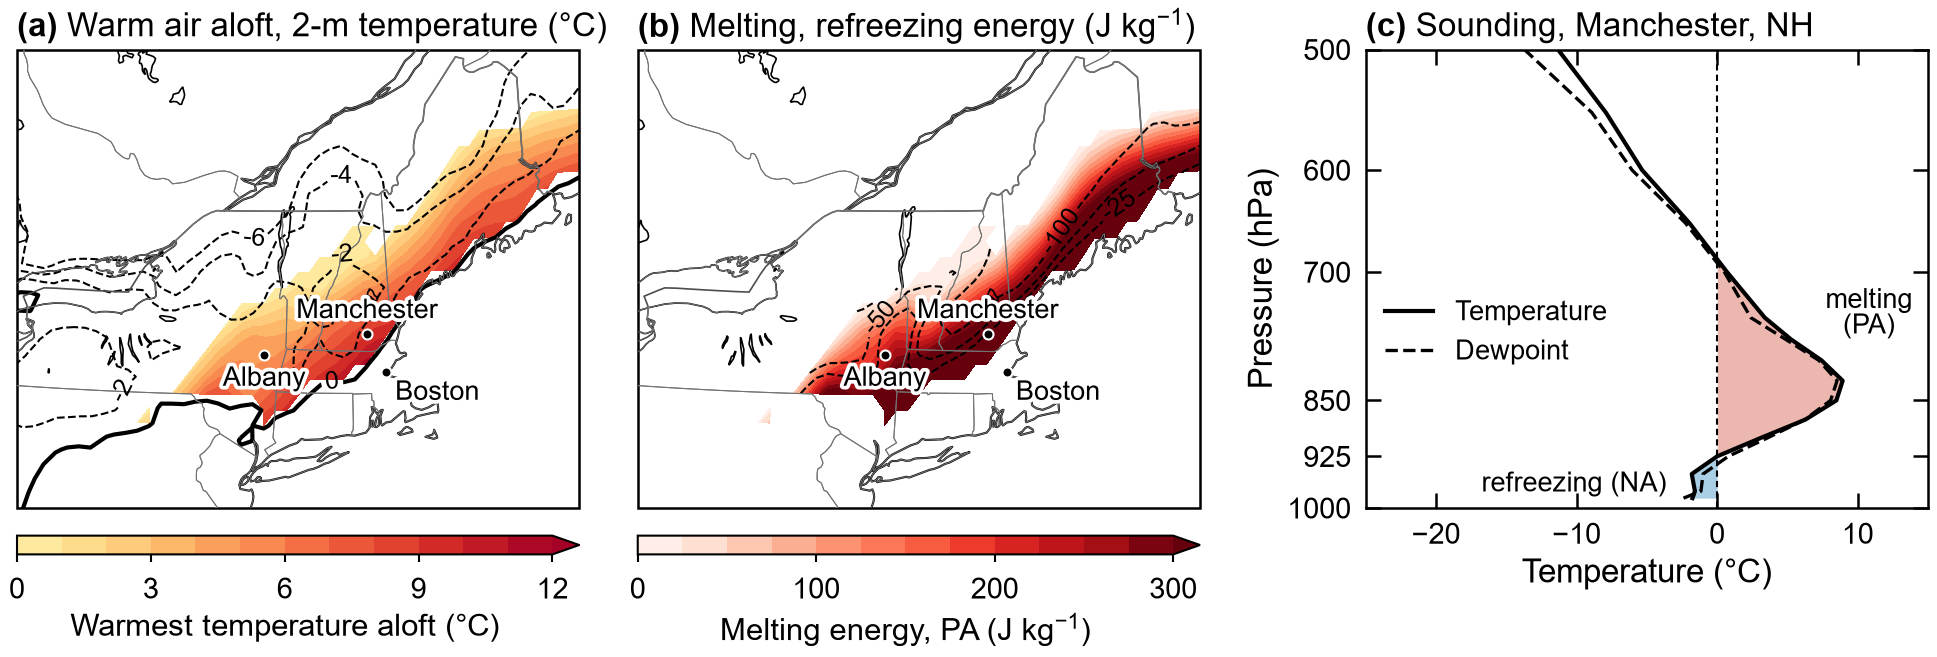
How forecasters identify it. The precipitation type is read from the sounding, which Bourgouin (2000) reduced to two numbers: a melting energy for the warm layer (PA, for positive area) and a refreezing energy for the cold layer (NA, negative area), which together indicate the type (Fig. 28b). Birk et al. (2021) revised the method to use the wet-bulb temperature (the temperature air reaches when water evaporates into it) and to give probabilities. In the ice storm of December 2008, Worcester reported freezing rain at 30–31 °F (about −1 °C) for ten hours from the afternoon of 11 December. ERA5 at 0900 UTC (4 a.m. EST) 12 December (Fig. 28) has a warm nose of up to 9 °C (48 °F) above below-freezing air over southern New Hampshire.
“Low pressure moving northeastward from the southeast states will bring lots of precipitation with it...which will fall into the low level cold air. This will result in an ice storm for portions of interior southern New England tonight.”
4.2 Bomb cyclone
A bomb cyclone is a storm whose central pressure falls unusually fast: by about 24 hPa in 24 hours at 60° latitude, and by less at lower latitudes, about 18–20 hPa at New England’s latitude.
How it forms. Off the East Coast in winter, cold continental air lies beside warm air over the Gulf Stream. A strong jet stream removes air from the top of the storm faster than it flows in below, so the surface pressure drops, and heat released by condensing water vapor speeds this up. Sanders and Gyakum (1980) set the threshold at 60°N, the latitude of southern Greenland, and lowered it toward the equator, where the same wind comes with a smaller pressure difference (the threshold is 24 hPa × sin latitude / sin 60°).
Winds rise quickly, and the storm brings heavy snow or rain and coastal flooding.
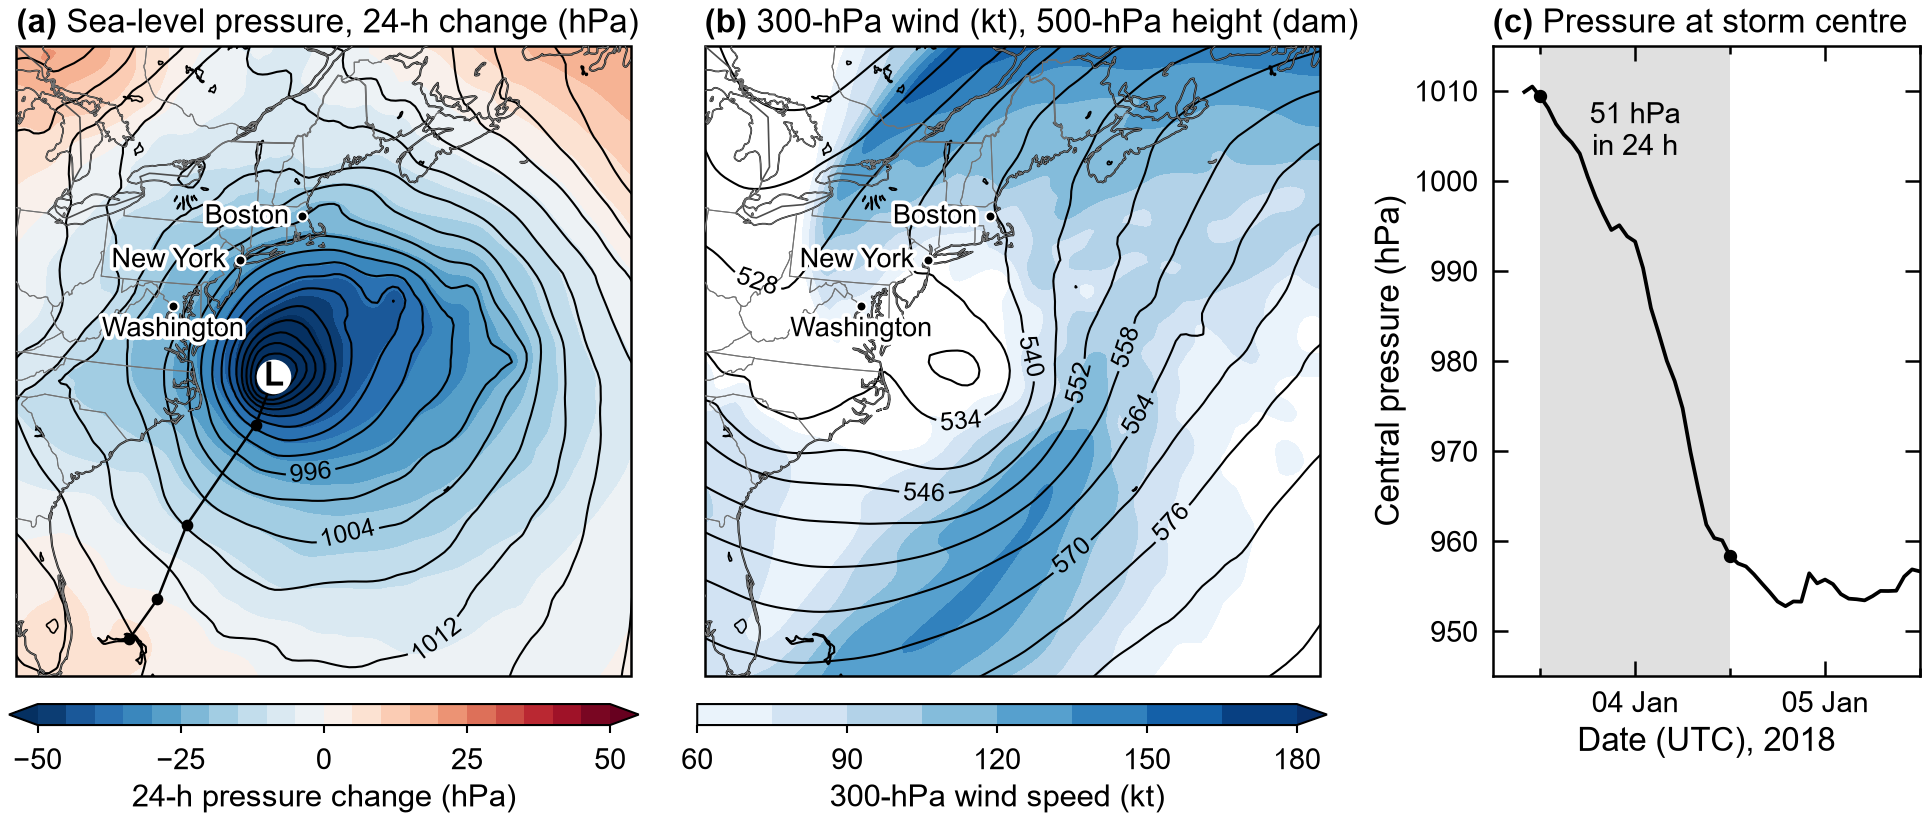
How forecasters identify it. The test is the 24-h fall in central pressure compared with the threshold. In ERA5 (Fig. 30) the central pressure of the January 2018 storm fell 51 hPa in 24 h, from 1009 hPa (close to the average sea-level pressure of 1013 hPa) to 958 hPa, between 1200 UTC (7 a.m. EST) 3 and 4 January. Most of the fall came off the Southeast coast, at an average latitude of about 31°N (near the Georgia–Florida border), where the threshold is about 14 hPa, so the storm deepened about 3.5 times faster than the threshold. Passing New England, it pushed the Boston tide gauge to its highest level since records began in 1921 (Boston Globe, 5 Jan 2018).
“…a massive bombing surface low taking shape up the E coast, lowering down to around 950 mb offshore of New England as it quickly races NNE into SE Canada Thursday morning.”
4.3 Alberta clipper
An Alberta clipper is a small, fast-moving low that forms east of the Canadian Rockies and races southeast toward the Great Lakes and the Northeast, bringing light snow followed by a surge of arctic air.
Pacific air descending the Canadian Rockies forms a low-pressure trough on their sheltered (lee) side. A small disturbance in the jet stream (a short-wave trough) turns it into a low, which strong northwest winds aloft carry quickly southeast. Of 177 clippers in Thomas and Martin (2007), most occurred in December and January and tracked toward or just north of Lake Superior; fewer than 10% passed south of the Great Lakes.
A clipper brings a few inches (under 10 cm) of light, powdery snow from cold, dry air, then gusty northwest winds and sharp cooling.
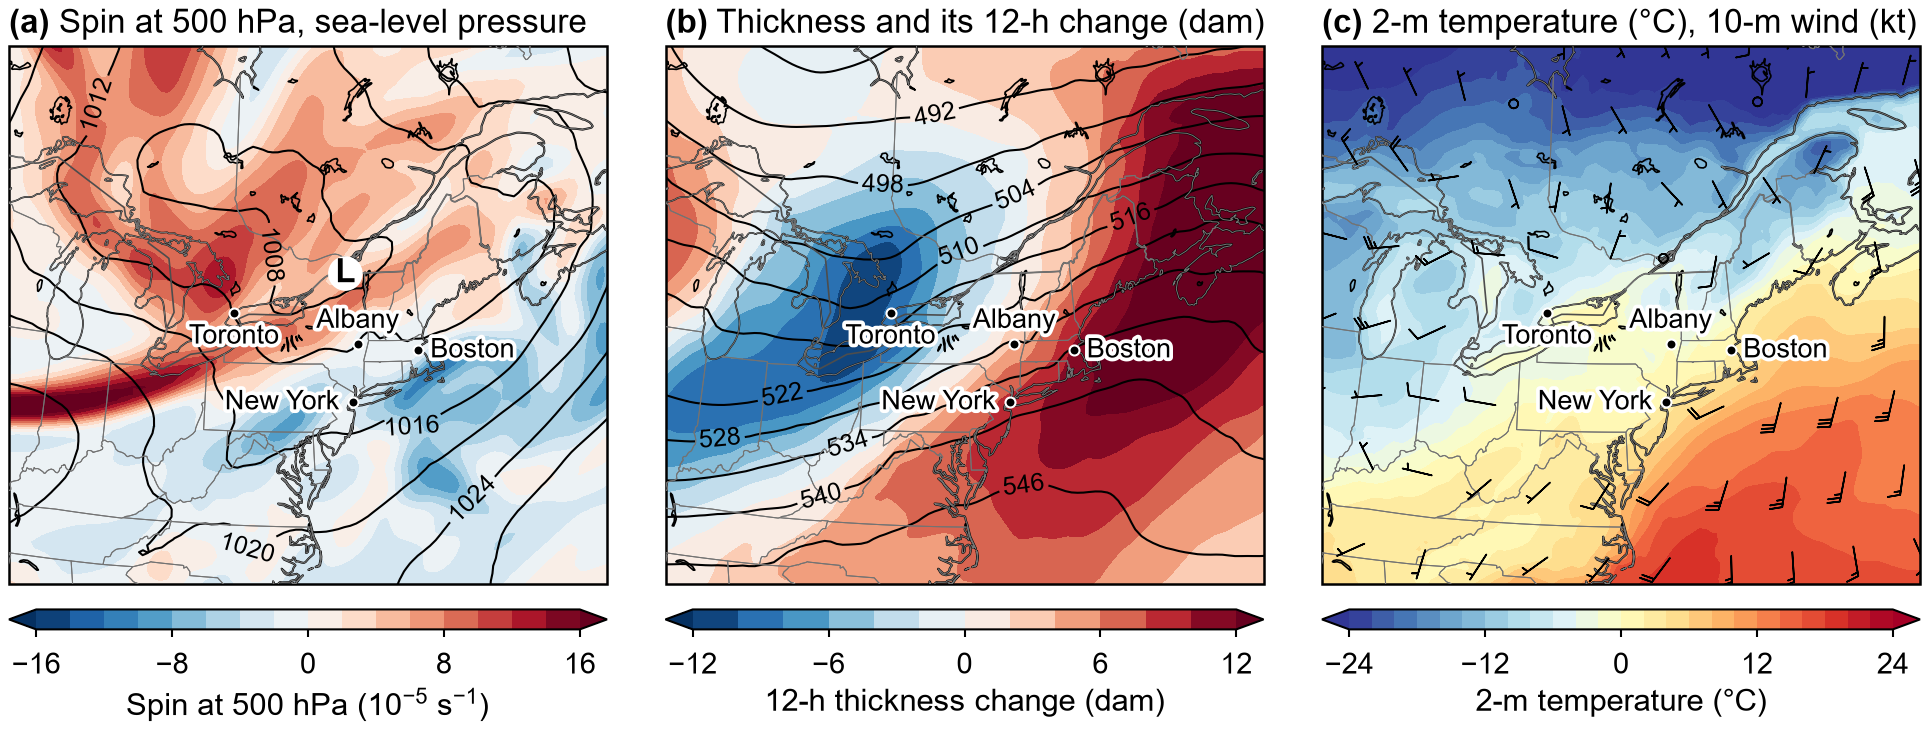
How forecasters identify it. The short-wave trough is found on 500-hPa maps, together with falling thickness (the depth of a layer of air, which shrinks as the air cools). In the Thomas and Martin composite, the strongest spin of the winds at 500 hPa stays west of the surface low once the clipper leaves the Rockies, so the surface low runs ahead of the disturbance aloft that drives it. A clipper reached the New York–Quebec border at 7 p.m. EST on 22 January 2008 (0000 UTC 23 January; Fig. 32), with the strongest spin aloft 450 km west. That afternoon Worcester and Hartford had light snow and Boston light rain.
“A clipper moves across the region Tue and Tue night. … Reinforcing shot of cold air flows into region behind this system.”
5. Convective and mesoscale boundaries
Thunderstorms create boundaries tens to hundreds of kilometers long, and other boundaries set thunderstorms off. Most are too narrow to appear clearly in a reanalysis with a 25–30 km grid, so the maps for these cases show the setting rather than the boundary itself.
5.1 Gust front and cold pool
A gust front is the leading edge of the cool air that spreads out from under a thunderstorm; when it passes, the wind gusts and changes direction and the temperature drops within minutes.
How it forms. Rain evaporating below a thunderstorm cools the air. The denser air sinks as a downdraft and spreads along the ground as a cold pool about 1 km deep, a flow of dense fluid under lighter fluid called a gravity current (Charba 1974). Its leading edge is the gust front.
Behind the gust front the temperature can fall more than 10 °F (5.5 °C), and a low shelf cloud often accompanies it. New storms tend to form where it lifts the humid air ahead.
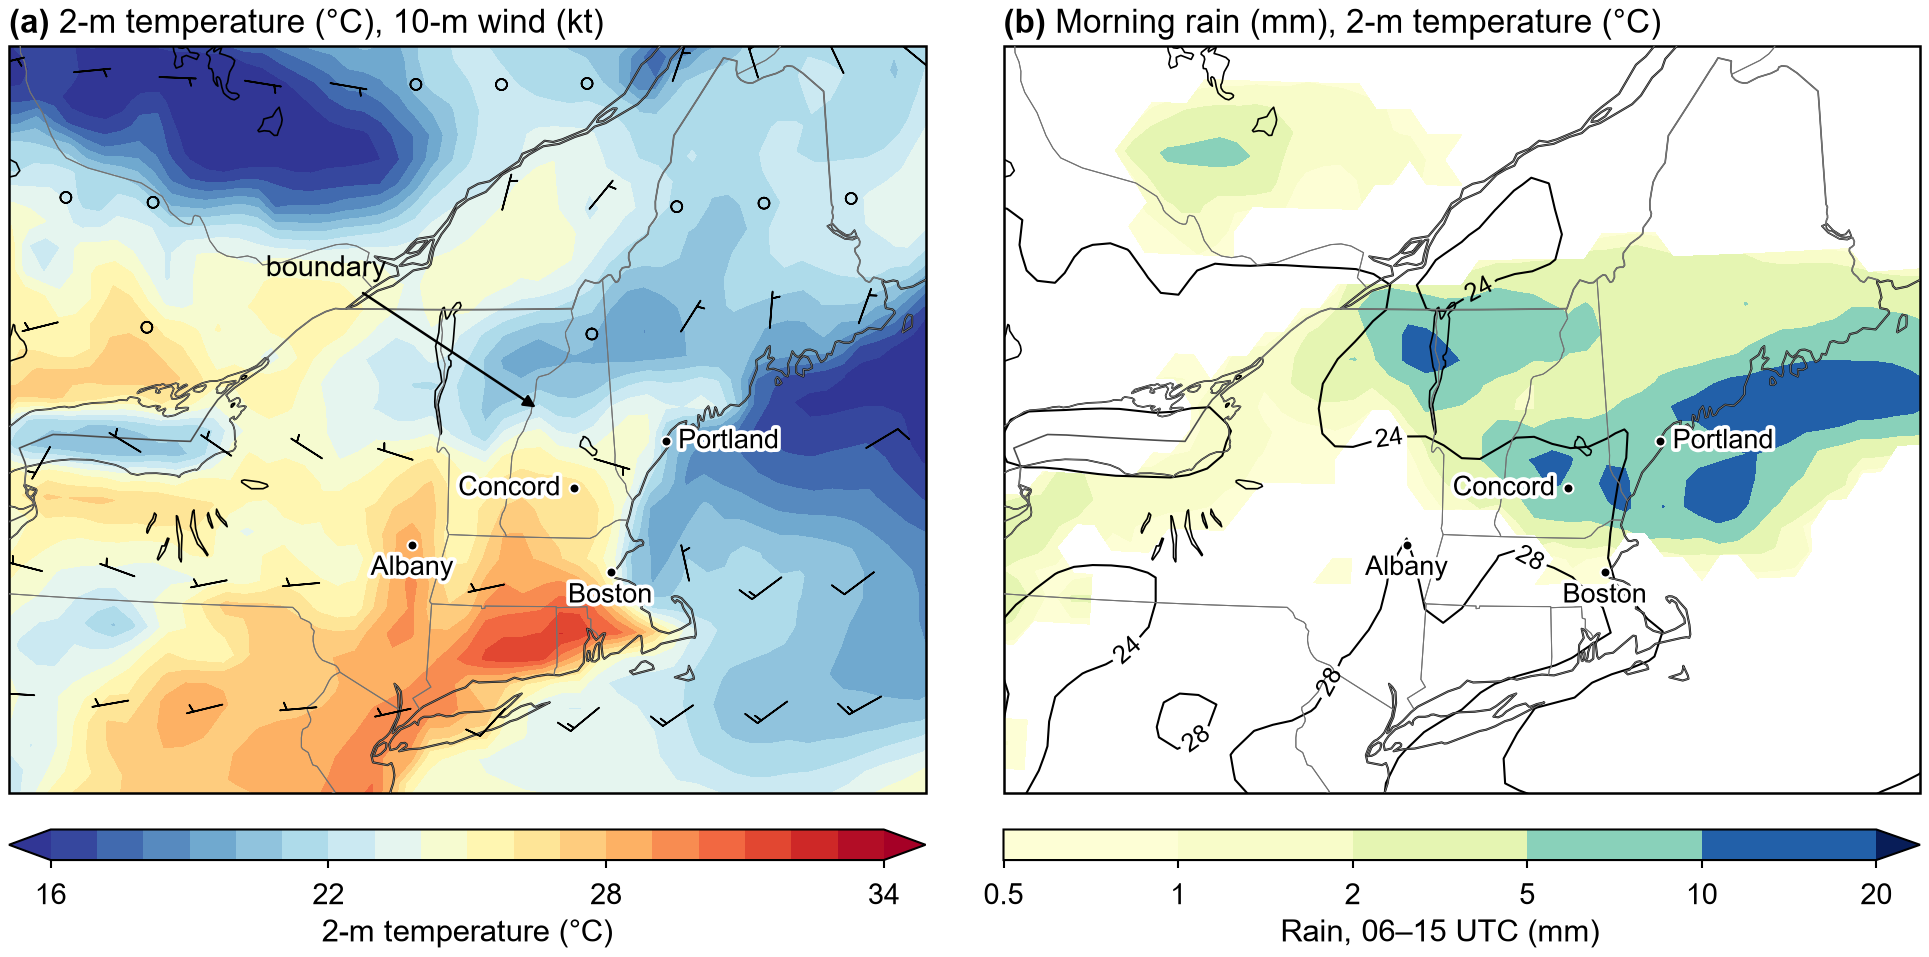
How forecasters identify it. Radar often shows a gust front as a thin line of weak echo (signal reflected back to the radar), and surface stations record the pressure jump, cooling and wind shift. Wakimoto (1982) traced the life cycle of gust fronts with Doppler radar and weather balloons. Gust fronts are easily confused with backdoor and sea-breeze fronts (Sections 1.2 and 1.1), as on 8 July 2013. At 10:37 a.m. EDT the Boston office described a boundary moving south as possible outflow from morning storms; by 2:38 p.m. it called the same boundary a “back door cold front/sea breeze” (archived text). ERA5 shows the cooler air north of the boundary at 1800 UTC (2 p.m. EDT; Fig. 34).
“Surface analysis show[s] that a weak boundary...perhaps outflow from morning convection is moving southward towards SNE [southern New England]. In fact winds are out of the NE at MHT/LWM and BVY.”
5.2 Derecho
A derecho is a long-lived windstorm produced by a fast-moving line or cluster of thunderstorms, whose straight-line winds damage a swath at least 400 km (250 mi) long.
How it forms. New storms keep forming at the leading edge of a thunderstorm cluster’s strong cold pool, so the system moves faster than the winds around it. Air flowing in from behind, the rear-inflow jet, descends toward the ground and pushes the middle of the line ahead of its ends, bowing it into a bow echo on radar. The strongest winds are at the apex of the bow. Most derechos occur in the central United States.
Gusts reach 60–90 mph (27–40 m s⁻¹), felling trees and power lines.
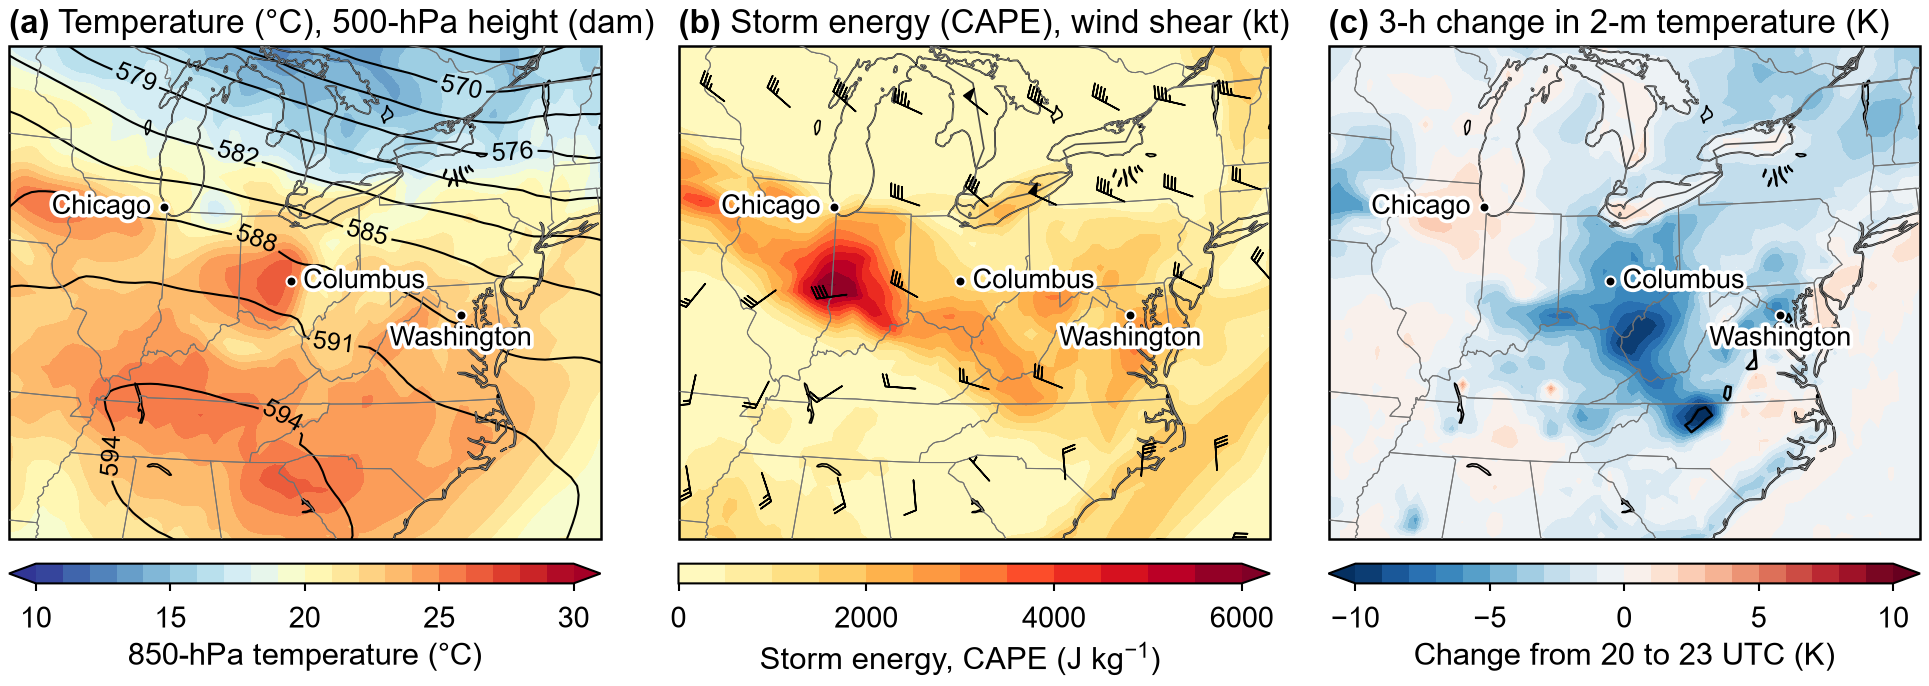
Forecasters look for a bowing line on radar and large instability (energy available to rising air). Johns and Hirt (1987) revived the term; Corfidi et al. (2016) and Squitieri et al. (2025) revised its definition. The Storm Prediction Center also requires gusts of at least 58 mph along the swath, several of them 75 mph or more (SPC). On 29 June 2012 a derecho crossed about 700 mi (1100 km) in 12 h, from northern Indiana at about 1800 UTC (2 p.m. EDT) to the Delaware and New Jersey coast, with gusts to 91 mph at Fort Wayne, Ind. (SPC case page). Because the storms were far smaller than ERA5’s grid, its strongest gust that afternoon (Fig. 36) is only 34 kt (39 mph).
5.3 Dryline
A dryline is a boundary, usually over the southern and central Great Plains in spring, between humid air from the Gulf of Mexico and very dry air from the desert Southwest; thunderstorms often form along it.
Humid Gulf air spreads north in a shallow layer; to the west, where the land rises, the air is hot and dry. By day, mixing brings dry air down through the thin western edge of the humid layer, so the dryline moves east; at night it drifts back west (Schaefer 1974). The Northeast has no dryline. It is included for contrast with the sea-breeze and backdoor fronts (Sections 1.1 and 1.2): those separate cool air from warm air, while the dryline separates mainly moist air from dry air.
At the surface. Crossing the line westward, the dewpoint can fall 20 °F (11 °C) or more. Rising air along the dryline starts many of the Plains’ spring severe storms and tornadoes.
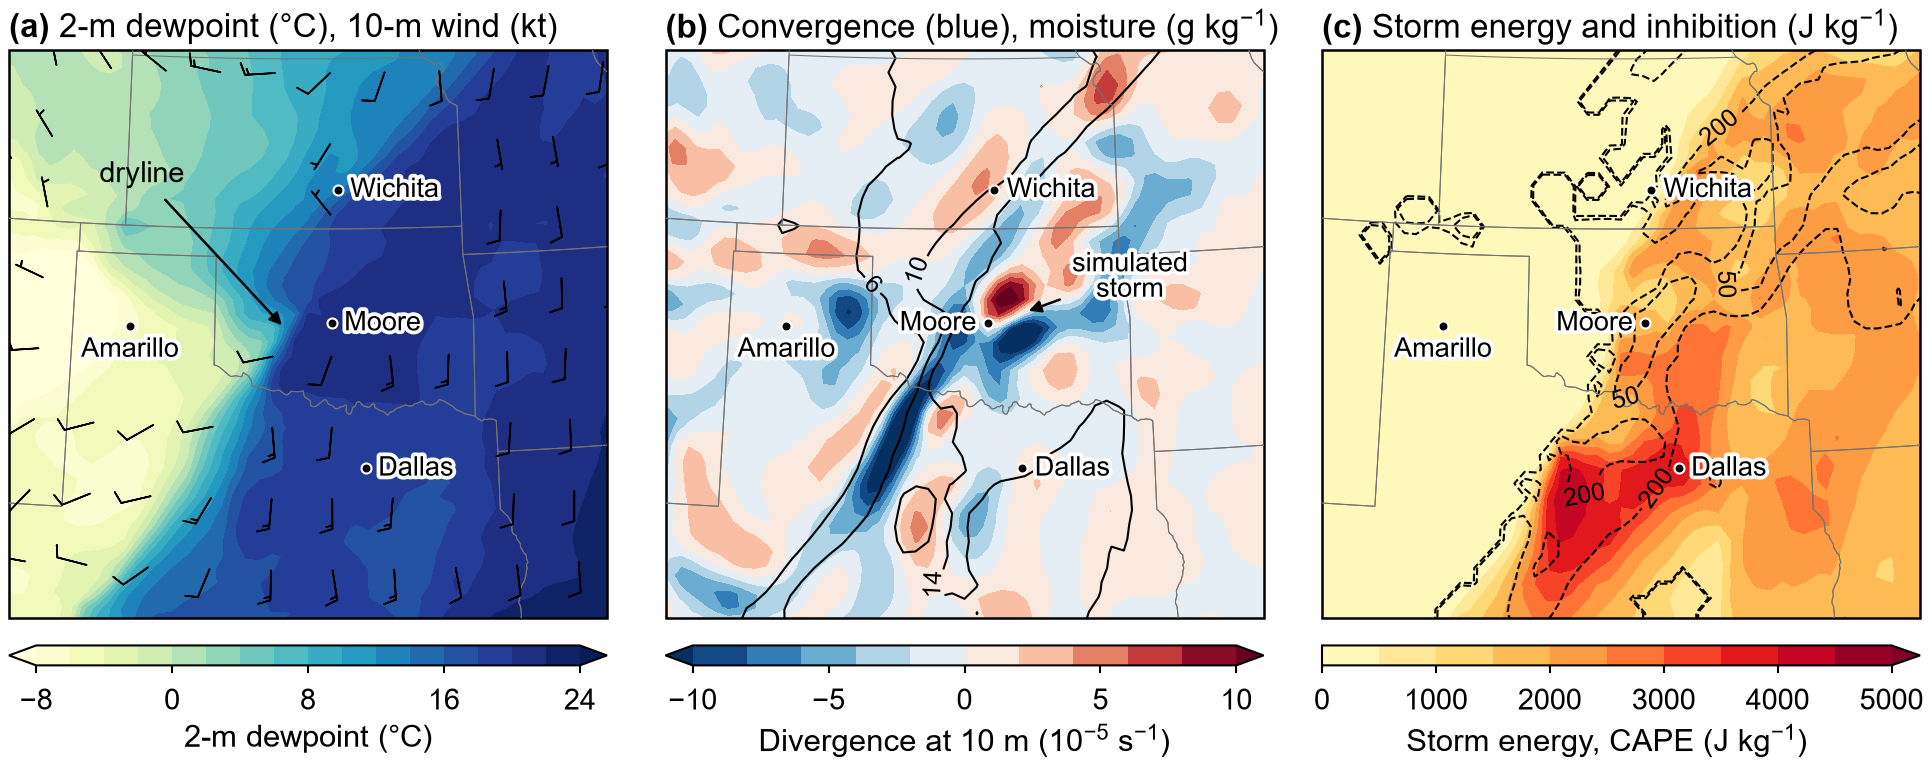
On surface maps the dryline lies along the tightest dewpoint gradient, where winds converge. In 30 years of observations, Hoch and Markowski (2005) found a dryline on 32% of April–June days, most often in mid- to late May, usually near 101°W (through the Texas Panhandle and western Kansas). On 20 May 2013 storms formed along the Oklahoma dryline; one produced the Moore tornado at about 1956 UTC (2:56 p.m. CDT), an hour after the discussion below. ERA5 at 2100 UTC (Fig. 38) spreads the dryline’s 20 °C (36 °F) dewpoint jump over several grid boxes.
“Rapid thunderstorm development is expected over the next hour or two along the dryline and stationary boundary.”
6. Large-scale patterns
The last two systems are set by the large-scale flow. An omega block spans several thousand kilometers and can hold the Northeast’s weather in place for a week. The Santa Ana wind of Southern California, driven by high pressure over the Great Basin, is included as the dry, offshore opposite of the Northeast’s sea breeze and marine layer.
6.1 Omega block
An omega block is a large, nearly stationary pattern in the winds about 5–6 km up: a high-pressure ridge between two lows, shaped like the Greek letter Ω, that holds the weather in place for days.
The jet stream normally carries weather systems west to east every few days. Sometimes its meanders grow until a ridge pushes far north and lows are cut off on either side. The jet then splits and flows around the block, and the systems that would normally push the pattern east are steered around it instead, so the block can persist for a week or more. Rex (1950) first described blocking systematically.
Under the ridge, sinking air warms and dries, so clouds dissolve and days are clear, warm and dry (in summer, heat waves and stagnant air). Under the lows, cool, showery days follow one another. Week-ahead forecasts hinge on when a block forms and when it breaks down.
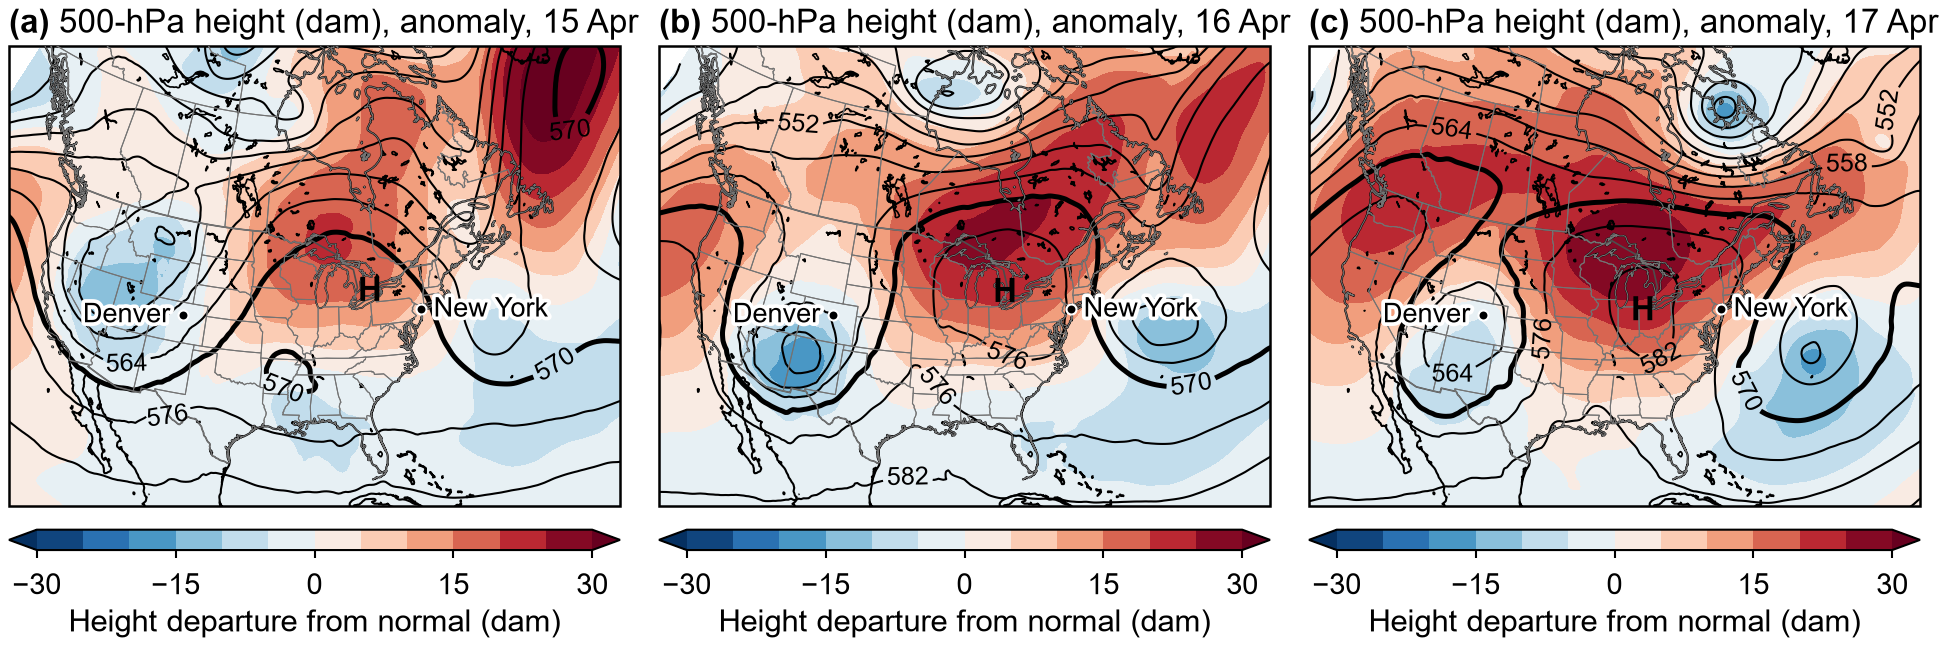
How forecasters identify it. On 500-hPa maps a block appears as a high that has stopped moving, flanked by closed lows. Normally the height of the 500-hPa surface decreases toward the pole. The index of Tibaldi and Molteni (1990) flags a block where, near 60°N, the height increases toward the pole instead; they used it to test how well a forecast model predicted blocks.
In April 2016 a closed high sat over the Great Lakes from 15 to 18 April, flanked from 16 April by cut-off lows over the southern Rockies and the western Atlantic (Fig. 40). The block had broken down by 19–20 April.
“Quiet weather continues as an omega blocking pattern aloft remains in place, with the ridge across the eastern half of the country, and high pressure at the surface remaining in control as well.”
6.2 Santa Ana wind
The Santa Ana is a hot, very dry, gusty wind that blows from the interior deserts through mountain passes and canyons to the Southern California coast, mostly from autumn to early spring.
High pressure over the Great Basin and cold, dense desert air make pressure higher inland than at the coast. Hughes and Hall (2010) found that “unless synoptic [large-scale] conditions force strongly onshore winds, the local thermodynamic forcing [the desert–ocean temperature contrast] is the primary control on Santa Ana variability.” As the air descends the mountains to the coast it is compressed and warms about 10 °C per km, and its relative humidity drops, often below 10%, although no water is removed.
Effects. Northeast winds gust to 25–50 mph in passes and canyons, and the coast turns hot with very low humidity. Coming after the dry summer, these winds bring Southern California’s worst fire weather.
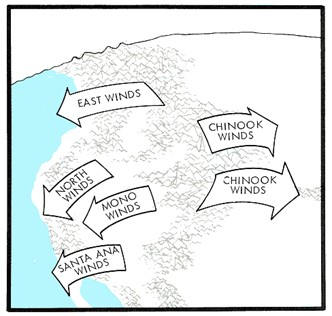
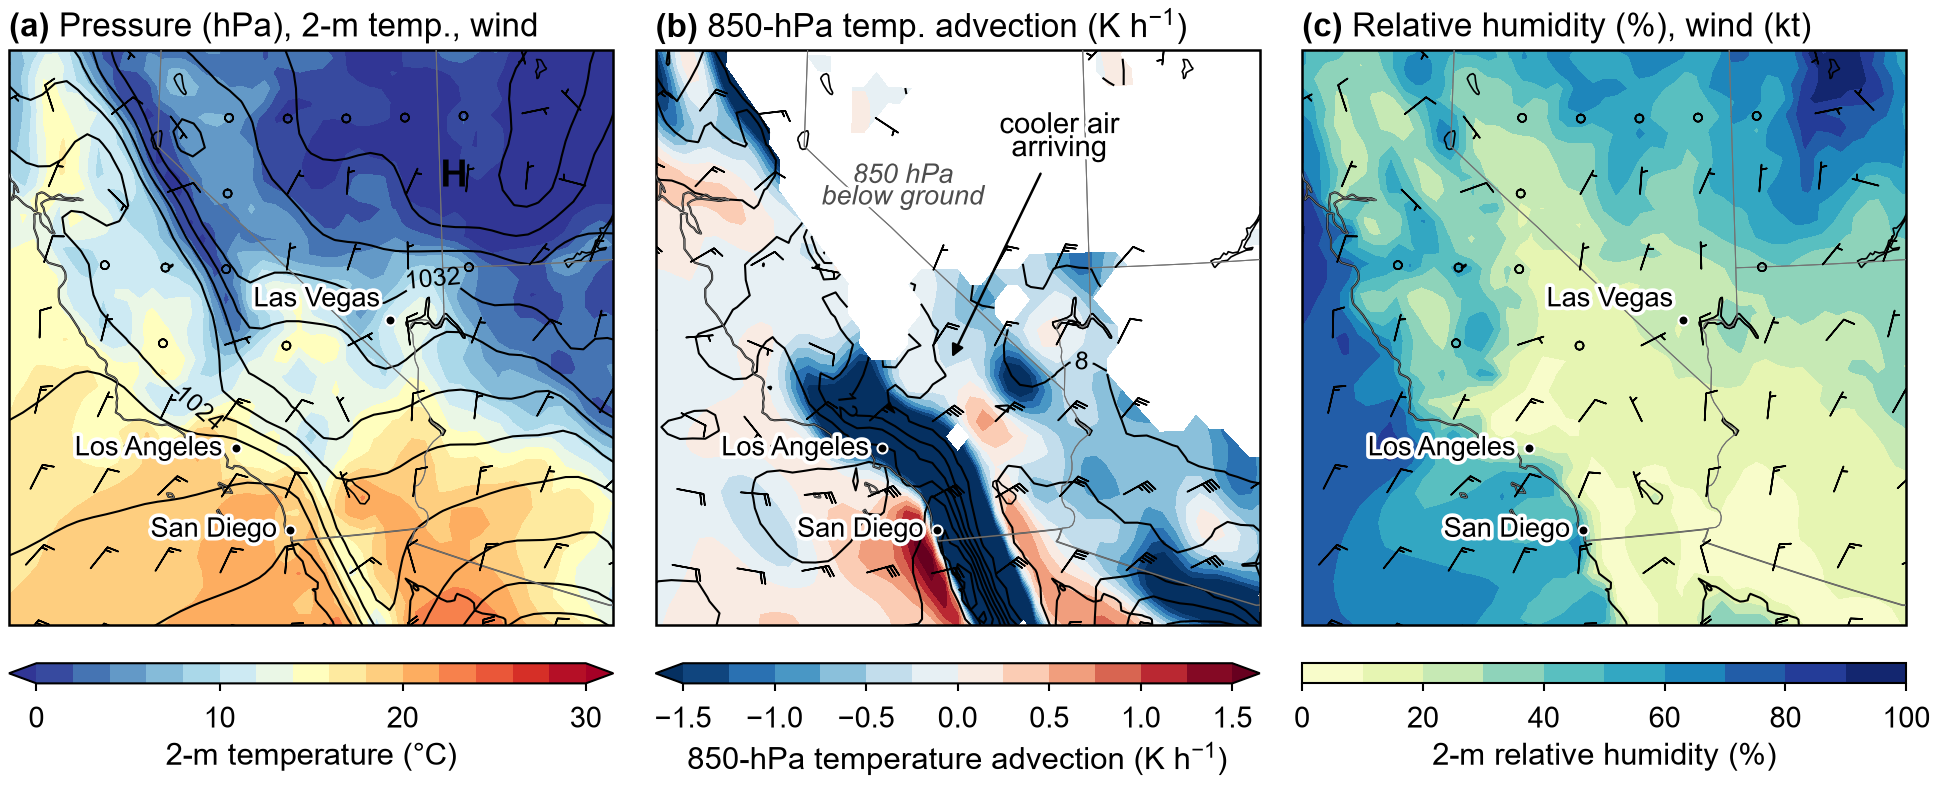
How forecasters identify it. The standard measure is the pressure difference between Los Angeles airport (LAX) and Daggett (DAG), in the Mojave Desert; a negative value means higher pressure inland. The Santa Ana Wildfire Threat Index (Rolinski et al. 2016) combines wind, humidity and vegetation dryness. At 850 hPa (1.5 km) forecasters look for northeast winds carrying cold air over the interior (cold-air advection), the same air that reaches the coast hot after its descent. ERA5 at 0900 UTC 22 October 2007 (2 a.m. PDT; Fig. 42) shows the Great Basin high and this cold-air advection. During the fires that week, LAX reached 84–94 °F (29–34 °C) on 22–24 October, 10–20 °F (6–11 °C) above normal.
“The big story continues to be the current Santa Ana wind event. The strong offshore flow continues with an incredibly strong LAX-DAG pressure gradient dipping below -10 mb earlier today.”
Data and methods
The case maps use the ERA5 reanalysis produced by the European Centre for Medium-Range Weather Forecasts (ECMWF) for the Copernicus Climate Change Service (Hersbach et al. 2020). Hourly fields on the 0.25° grid were read from Google's Analysis-Ready, Cloud-Optimized copy of ERA5 (ARCO-ERA5) and plotted with Python (xarray and Matplotlib). Each map shows the fields named in its caption at the stated time.
Forecaster quotations come from National Weather Service Area Forecast Discussions held in the Iowa Environmental Mesonet text archive. Each quotation links to the exact product it is taken from. Examples given without a link are paraphrased.
The schematics were drawn for this page. Where a published public-domain drawing adds information, it is reproduced beside the schematic and credited in the caption.
Statements about how forecasters recognize each system summarize the cited papers, drawn from a reading of 53 peer-reviewed papers on these systems and on model temperature forecasts, supplemented by the AMS Glossary of Meteorology. Identification methods given without a citation reflect standard National Weather Service forecasting practice. The counts of midnight highs in Section 3.3 were made for this page from hourly airport observations.
Acknowledgments
Generated using Copernicus Climate Change Service information (2026); neither the European Commission nor ECMWF is responsible for any use of this information. The ARCO-ERA5 copy is hosted by Google Cloud Public Datasets, and the text archive is maintained by the Iowa Environmental Mesonet at Iowa State University. Reproduced schematics are credited to their sources in the figure captions.
References
- Adler, B., J. M. Wilczak, J. Kenyon, L. Bianco, I. V. Djalalova, J. B. Olson, and D. D. Turner, 2023: Evaluation of a cloudy cold-air pool in the Columbia River basin in different versions of the High-Resolution Rapid Refresh (HRRR) model. Geosci. Model Dev., 16, 597–619, https://doi.org/10.5194/gmd-16-597-2023.
- AMS, 2026: Glossary of Meteorology. Amer. Meteor. Soc., entries “Backdoor cold front,” “Coastal front” and “Sea fog,” accessed 8 October 2026, https://glossary.ametsoc.org/wiki/Welcome.
- Atkins, N. T., R. M. Wakimoto, and T. M. Weckwerth, 1995: Observations of the sea-breeze front during CaPE. Part II: Dual-Doppler and aircraft analysis. Mon. Wea. Rev., 123, 944–969, https://doi.org/10.1175/1520-0493(1995)123<0944:OOTSBF>2.0.CO;2.
- Bell, G. D., and L. F. Bosart, 1988: Appalachian cold-air damming. Mon. Wea. Rev., 116, 137–161, https://doi.org/10.1175/1520-0493(1988)116<0137:ACAD>2.0.CO;2.
- Birk, K., E. Lenning, K. Donofrio, and M. T. Friedlein, 2021: A revised Bourgouin precipitation-type algorithm. Wea. Forecasting, 36, 425–438, https://doi.org/10.1175/WAF-D-20-0118.1.
- Blackadar, A. K., 1957: Boundary layer wind maxima and their significance for the growth of nocturnal inversions. Bull. Amer. Meteor. Soc., 38, 283–290, https://doi.org/10.1175/1520-0477-38.5.283.
- Bosart, L. F., 1975: New England coastal frontogenesis. Quart. J. Roy. Meteor. Soc., 101, 957–978, https://doi.org/10.1002/qj.49710143016.
- Bourgouin, P., 2000: A method to determine precipitation types. Wea. Forecasting, 15, 583–592, https://doi.org/10.1175/1520-0434(2000)015<0583:AMTDPT>2.0.CO;2.
- Charba, J., 1974: Application of gravity current model to analysis of squall-line gust front. Mon. Wea. Rev., 102, 140–156, https://doi.org/10.1175/1520-0493(1974)102<0140:AOGCMT>2.0.CO;2.
- Coniglio, M. C., J. Correia Jr., P. T. Marsh, and F. Kong, 2013: Verification of convection-allowing WRF model forecasts of the planetary boundary layer using sounding observations. Wea. Forecasting, 28, 842–862, https://doi.org/10.1175/WAF-D-12-00103.1.
- Corfidi, S. F., M. C. Coniglio, A. E. Cohen, and C. M. Mead, 2016: A proposed revision to the definition of “derecho.” Bull. Amer. Meteor. Soc., 97, 935–949, https://doi.org/10.1175/BAMS-D-14-00254.1.
- Ellis, A. W., M. L. Marston, and D. A. Nelson, 2018: An air mass-derived cool season climatology of synoptically forced Appalachian cold-air damming. Int. J. Climatol., 38, 530–542, https://doi.org/10.1002/joc.5189.
- Hersbach, H., and Coauthors, 2020: The ERA5 global reanalysis. Quart. J. Roy. Meteor. Soc., 146, 1999–2049, https://doi.org/10.1002/qj.3803.
- Hoch, J., and P. Markowski, 2005: A climatology of springtime dryline position in the U.S. Great Plains region. J. Climate, 18, 2132–2137, https://doi.org/10.1175/JCLI3392.1.
- Hughes, M., and A. Hall, 2010: Local and synoptic mechanisms causing Southern California’s Santa Ana winds. Climate Dyn., 34, 847–857, https://doi.org/10.1007/s00382-009-0650-4.
- Johns, R. H., and W. D. Hirt, 1987: Derechos: Widespread convectively induced windstorms. Wea. Forecasting, 2, 32–49, https://doi.org/10.1175/1520-0434(1987)002<0032:DWCIW>2.0.CO;2.
- Keshishian, L. G., and L. F. Bosart, 1987: A case study of extended East Coast frontogenesis. Mon. Wea. Rev., 115, 100–117, https://doi.org/10.1175/1520-0493(1987)115<0100:ACSOEE>2.0.CO;2.
- Kocin, P. J., and L. W. Uccellini, 2004: Northeast Snowstorms. Meteor. Monogr., No. 54, Amer. Meteor. Soc., https://doi.org/10.1007/978-1-878220-32-5.
- Koračin, D., C. E. Dorman, J. M. Lewis, J. G. Hudson, E. M. Wilcox, and A. Torregrosa, 2014: Marine fog: A review. Atmos. Res., 143, 142–175, https://doi.org/10.1016/j.atmosres.2013.12.012.
- Miller, J. E., 1946: Cyclogenesis in the Atlantic coastal region of the United States. J. Meteor., 3, 31–44, https://doi.org/10.1175/1520-0469(1946)003<0031:CITACR>2.0.CO;2.
- Miller, S. T. K., B. D. Keim, R. W. Talbot, and H. Mao, 2003: Sea breeze: Structure, forecasting, and impacts. Rev. Geophys., 41, 1011, https://doi.org/10.1029/2003RG000124.
- Nielsen, J. W., 1989: The formation of New England coastal fronts. Mon. Wea. Rev., 117, 1380–1401, https://doi.org/10.1175/1520-0493(1989)117<1380:TFONEC>2.0.CO;2.
- Niziol, T. A., 1987: Operational forecasting of lake effect snowfall in western and central New York. Wea. Forecasting, 2, 310–321, https://doi.org/10.1175/1520-0434(1987)002<0310:OFOLES>2.0.CO;2.
- Niziol, T. A., W. R. Snyder, and J. S. Waldstreicher, 1995: Winter weather forecasting throughout the eastern United States. Part IV: Lake effect snow. Wea. Forecasting, 10, 61–77, https://doi.org/10.1175/1520-0434(1995)010<0061:WWFTTE>2.0.CO;2.
- NWS State College, n.d.: Snow storm types. National Weather Service, State College, Pa., accessed 8 October 2026, https://www.weather.gov/ctp/SnowStormTypes.
- Patel, R. N., S. E. Yuter, M. A. Miller, S. R. Rhodes, L. Bain, and T. W. Peele, 2021: The diurnal cycle of winter season temperature errors in the operational Global Forecast System (GFS). Geophys. Res. Lett., 48, e2021GL095101, https://doi.org/10.1029/2021GL095101.
- Rex, D. F., 1950: Blocking action in the middle troposphere and its effect upon regional climate. Tellus, 2, 196–211, https://doi.org/10.1111/j.2153-3490.1950.tb00331.x.
- Riordan, A. J., G. M. Lackmann, and L. Xie, 2003: Improving forecasts of topographically-forced weather systems in the Carolinas and Virginia. Final Scientific Progress Report, NOAA CSTAR Award NA07WA0206, North Carolina State University, 17 pp. Project report; not peer reviewed. https://www.weather.gov/media/rah/science/NCSU_CSTAR_I_Final_Report.pdf.
- Rolinski, T., S. B. Capps, R. G. Fovell, Y. Cao, B. J. D’Agostino, and S. Vanderburg, 2016: The Santa Ana wildfire threat index: Methodology and operational implementation. Wea. Forecasting, 31, 1881–1897, https://doi.org/10.1175/WAF-D-15-0141.1.
- Sanders, F., and J. R. Gyakum, 1980: Synoptic-dynamic climatology of the “bomb.” Mon. Wea. Rev., 108, 1589–1606, https://doi.org/10.1175/1520-0493(1980)108<1589:SDCOT>2.0.CO;2.
- Schaefer, J. T., 1974: The life cycle of the dryline. J. Appl. Meteor., 13, 444–449, https://doi.org/10.1175/1520-0450(1974)013<0444:TLCOTD>2.0.CO;2.
- Schroeder, M. J., and C. C. Buck, 1970: Fire Weather: A Guide for Application of Meteorological Information to Forest Fire Control Operations. Agriculture Handbook 360, U.S. Department of Agriculture, Forest Service. Reprinted as NWCG PMS 425-1, https://www.nwcg.gov/publications/pms425-1.
- Squitieri, B. J., A. R. Wade, and I. L. Jirak, 2025: On a modified definition of a derecho. Part I: Construction of the definition and quantitative criteria for identifying future derechos over the contiguous United States. Bull. Amer. Meteor. Soc., 106, E84–E110, https://doi.org/10.1175/BAMS-D-24-0015.1.
- Stull, R. B., 1988: An Introduction to Boundary Layer Meteorology. Kluwer Academic, https://doi.org/10.1007/978-94-009-3027-8.
- Thomas, B. C., and J. E. Martin, 2007: A synoptic climatology and composite analysis of the Alberta clipper. Wea. Forecasting, 22, 315–333, https://doi.org/10.1175/WAF982.1.
- Tibaldi, S., and F. Molteni, 1990: On the operational predictability of blocking. Tellus, 42A, 343–365, https://doi.org/10.3402/tellusa.v42i3.11882.
- Van de Wiel, B. J. H., A. F. Moene, G. J. Steeneveld, P. Baas, F. C. Bosveld, and A. A. M. Holtslag, 2010: A conceptual view on inertial oscillations and nocturnal low-level jets. J. Atmos. Sci., 67, 2679–2689, https://doi.org/10.1175/2010JAS3289.1.
- Wakimoto, R. M., 1982: The life cycle of thunderstorm gust fronts as viewed with Doppler radar and rawinsonde data. Mon. Wea. Rev., 110, 1060–1082, https://doi.org/10.1175/1520-0493(1982)110<1060:TLCOTG>2.0.CO;2.